Merlin's response gave you a possible resolution.
Go there.

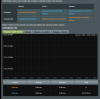
Set method to netstat
Set option to tcp sockets
Resolve name set to the option that you prefer (I use no)
Click on Netstat button
This will show your tcp connections. By paying attention to the "time wait" entries you should be able to identify the source(s) of the tcp connections producing those syslog entries that you are concerned about.
Thanks for the response. I looked at the Netsat, mine was set to display all sockets. The box was empty and well... I didn't think to hit click on netsat button... doh! I'm not sure what it said because after too many hours messing with it I reverted back to 380.59. I was running that firmware 30 days plus without a single issue. I was rebooting the router because I thought it was due, not because it was acting up. Figured for now, it was the safest bet.
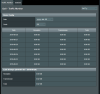
No, it appears it my macbook!
tcp 0 0 192.168.1.1:80 192.168.1.5:51631 TIME_WAIT
tcp 0 0 192.168.1.1:80 192.168.1.5:51545 TIME_WAIT
tcp 0 0 192.168.1.1:80 192.168.1.5:51556 TIME_WAIT
tcp 0 0 192.168.1.1:80 192.168.1.5:51569 TIME_WAIT
tcp 0 0 192.168.1.1:80 192.168.1.5:51592 TIME_WAIT
tcp 0 0 192.168.1.1:80 192.168.1.5:51534 TIME_WAIT
tcp 0 0 192.168.1.1:80 192.168.1.5:51598 TIME_WAIT
tcp 0 0 192.168.1.1:80 192.168.1.5:51550 TIME_WAIT
tcp 0 0 192.168.1.1:80 192.168.1.5:51549 TIME_WAIT
tcp 0 0 192.168.1.1:80 192.168.1.5:51560 TIME_WAIT
tcp 0 0 192.168.1.1:80 192.168.1.5:51552 TIME_WAIT
tcp 0 0 192.168.1.1:80 192.168.1.5:51563 TIME_WAIT
tcp 0 0 192.168.1.1:80 192.168.1.5:51553 TIME_WAIT
tcp 0 0 192.168.1.1:80 192.168.1.5:51599 TIME_WAIT
tcp 0 0 192.168.1.1:80 192.168.1.5:51578 TIME_WAIT
tcp 0 0 192.168.1.1:80 192.168.1.5:51573 TIME_WAIT
tcp 0 0 192.168.1.1:80 192.168.1.5:51540 TIME_WAIT
tcp 0 0 192.168.1.1:80 192.168.1.5:51617 TIME_WAIT
tcp 0 0 192.168.1.1:80 192.168.1.5:51600 TIME_WAIT
tcp 0 0 192.168.1.1:80 192.168.1.5:51536 TIME_WAIT
tcp 0 0 192.168.1.1:80 192.168.1.5:51547 TIME_WAIT
tcp 0 0 192.168.1.1:80 192.168.1.5:51551 TIME_WAIT
tcp 0 0 192.168.1.1:80 192.168.1.5:51524 TIME_WAIT
tcp 656 0 192.168.1.1:80 192.168.1.5:51641 ESTABLISHED
tcp 0 0 192.168.1.1:80 192.168.1.5:51595 TIME_WAIT
tcp 0 0 192.168.1.1:80 192.168.1.5:51611 TIME_WAIT
tcp 0 0 192.168.1.1:80 192.168.1.5:51608 TIME_WAIT
tcp 0 0 192.168.1.1:80 192.168.1.5:51586 TIME_WAIT
tcp 0 0 192.168.1.1:80 192.168.1.5:51596 TIME_WAIT
tcp 0 0 192.168.1.1:80 192.168.1.5:51622 TIME_WAIT
tcp 0 0 192.168.1.1:80 192.168.1.5:51585 TIME_WAIT
tcp 0 0 192.168.1.1:80 192.168.1.5:51579 TIME_WAIT
tcp 0 0 192.168.1.1:80 192.168.1.5:51568 TIME_WAIT
tcp 0 0 192.168.1.1:80 192.168.1.5:51580 TIME_WAIT
tcp 0 0 192.168.1.1:80 192.168.1.5:51590 TIME_WAIT
tcp 0 0 192.168.1.1:80 192.168.1.5:51558 TIME_WAIT
tcp 0 0 192.168.1.1:80 192.168.1.5:51605 TIME_WAIT
tcp 0 0 192.168.1.1:80 192.168.1.5:51559 TIME_WAIT
tcp 0 0 192.168.1.1:80 192.168.1.5:51535 TIME_WAIT
tcp 0 0 192.168.1.1:80 192.168.1.5:51630 TIME_WAIT
tcp 0 0 192.168.1.1:80 192.168.1.5:51610 TIME_WAIT
tcp 0 0 192.168.1.1:80 192.168.1.5:51541 TIME_WAIT
tcp 0 0 192.168.1.1:80 192.168.1.5:51618 TIME_WAIT
tcp 0 0 192.168.1.1:80 192.168.1.5:51584 TIME_WAIT
tcp 0 0 192.168.1.1:80 192.168.1.5:51561 TIME_WAIT
tcp 0 0 192.168.1.1:80 192.168.1.5:51621 TIME_WAIT
tcp 0 0 192.168.1.1:80 192.168.1.5:51614 TIME_WAIT
tcp 0 0 192.168.1.1:80 192.168.1.5:51544 TIME_WAIT
tcp 0 0 192.168.1.1:80 192.168.1.5:51575 TIME_WAIT
tcp 0 0 192.168.1.1:80 192.168.1.5:51628 TIME_WAIT
tcp 0 0 192.168.1.1:80 192.168.1.5:51574 TIME_WAIT
tcp 0 0 192.168.1.1:80 192.168.1.5:51555 TIME_WAIT
tcp 0 0 192.168.1.1:80 192.168.1.5:51530 TIME_WAIT
tcp 0 0 192.168.1.1:80 192.168.1.5:51581 TIME_WAIT
tcp 0 0 192.168.1.1:80 192.168.1.5:51523 TIME_WAIT
tcp 0 0 192.168.1.1:80 192.168.1.5:51594 TIME_WAIT
tcp 0 0 192.168.1.1:80 192.168.1.5:51528 TIME_WAIT
tcp 0 0 192.168.1.1:80 192.168.1.5:51539 TIME_WAIT
tcp 0 0 192.168.1.1:80 192.168.1.5:51570 TIME_WAIT
tcp 653 0 192.168.1.1:80 192.168.1.5:51643 ESTABLISHED
tcp 0 0 192.168.1.1:80 192.168.1.5:51543 TIME_WAIT
tcp 0 0 192.168.1.1:80 192.168.1.5:51571 TIME_WAIT
tcp 0 0 192.168.1.1:80 192.168.1.5:51638 TIME_WAIT
tcp 0 0 192.168.1.1:80 192.168.1.5:51616 TIME_WAIT
tcp 0 0 192.168.1.1:80 192.168.1.5:51529 TIME_WAIT
tcp 0 0 192.168.1.1:80 192.168.1.5:51606 TIME_WAIT
tcp 0 0 192.168.1.1:80 192.168.1.5:51588 TIME_WAIT
tcp 0 0 192.168.1.1:80 192.168.1.5:51562 TIME_WAIT
tcp 0 0 192.168.1.1:80 192.168.1.5:51548 TIME_WAIT
tcp 0 0 192.168.1.1:80 192.168.1.5:51632 TIME_WAIT
tcp 0 0 192.168.1.1:80 192.168.1.5:51531 TIME_WAIT
tcp 0 0 192.168.1.1:80 192.168.1.5:51626 TIME_WAIT
tcp 0 0 192.168.1.1:80 192.168.1.5:51601 TIME_WAIT
tcp 0 24687 192.168.1.1:80 192.168.1.5:51640 ESTABLISHED
tcp 0 0 192.168.1.1:80 192.168.1.5:51572 TIME_WAIT
tcp 0 0 192.168.1.1:80 192.168.1.5:51624 TIME_WAIT
tcp 0 0 192.168.1.1:80 192.168.1.5:51625 TIME_WAIT
tcp 0 0 192.168.1.1:80 192.168.1.5:51533 TIME_WAIT
tcp 0 0 192.168.1.1:80 192.168.1.5:51522 TIME_WAIT
tcp 658 0 192.168.1.1:80 192.168.1.5:51644 ESTABLISHED
tcp 0 0 192.168.1.1:80 192.168.1.5:51623 TIME_WAIT
tcp 0 0 192.168.1.1:80 192.168.1.5:51526 TIME_WAIT
tcp 0 0 192.168.1.1:80 192.168.1.5:51593 TIME_WAIT
tcp 0 0 192.168.1.1:80 192.168.1.5:51591 TIME_WAIT
tcp 0 0 192.168.1.1:80 192.168.1.5:51583 TIME_WAIT
tcp 0 0 192.168.1.1:80 192.168.1.5:51565 TIME_WAIT
tcp 0 0 192.168.1.1:80 192.168.1.5:51609 TIME_WAIT
tcp 0 0 192.168.1.1:80 192.168.1.5:51633 TIME_WAIT
tcp 0 0 192.168.1.1:80 192.168.1.5:51629 TIME_WAIT
tcp 0 0 192.168.1.1:80 192.168.1.5:51612 TIME_WAIT
tcp 0 0 192.168.1.1:80 192.168.1.5:51542 TIME_WAIT
tcp 0 0 192.168.1.1:80 192.168.1.5:51577 TIME_WAIT
tcp 0 0 192.168.1.1:80 192.168.1.5:51619 TIME_WAIT
tcp 0 0 192.168.1.1:80 192.168.1.5:51637 TIME_WAIT
tcp 0 0 192.168.1.1:80 192.168.1.5:51582 TIME_WAIT
tcp 0 0 192.168.1.1:80 192.168.1.5:51538 TIME_WAIT
tcp 0 0 192.168.1.1:80 192.168.1.5:51532 TIME_WAIT
tcp 0 0 192.168.1.1:80 192.168.1.5:51557 TIME_WAIT
tcp 0 0 192.168.1.1:80 192.168.1.5:51587 TIME_WAIT
tcp 0 0 192.168.1.1:80 192.168.1.5:51620 TIME_WAIT
tcp 0 0 192.168.1.1:80 192.168.1.5:51604 TIME_WAIT
tcp 0 0 192.168.1.1:80 192.168.1.5:51607 TIME_WAIT
tcp 654 0 192.168.1.1:80 192.168.1.5:51642 ESTABLISHED
tcp 0 0 192.168.1.1:80 192.168.1.5:51613 TIME_WAIT
tcp 0 0 192.168.1.1:80 192.168.1.5:51627 TIME_WAIT
tcp 0 0 192.168.1.1:80 192.168.1.5:51634 TIME_WAIT
tcp 0 0 192.168.1.1:80 192.168.1.5:51527 TIME_WAIT
tcp 0 0 192.168.1.1:80 192.168.1.5:51602 TIME_WAIT
tcp 0 0 192.168.1.1:80 192.168.1.5:51537 TIME_WAIT
tcp 0 0 192.168.1.1:80 192.168.1.5:51597 TIME_WAIT
tcp 0 0 192.168.1.1:80 192.168.1.5:51546 TIME_WAIT
tcp 0 0 192.168.1.1:80 192.168.1.5:51525 TIME_WAIT
tcp 0 0 192.168.1.1:80 192.168.1.5:51564 TIME_WAIT
tcp 0 0 192.168.1.1:80 192.168.1.5:51567 TIME_WAIT
tcp 0 3711 192.168.1.1:80 192.168.1.5:51639 FIN_WAIT1
tcp 0 0 192.168.1.1:80 192.168.1.5:51554 TIME_WAIT
tcp 0 0 192.168.1.1:80 192.168.1.5:51603 TIME_WAIT
tcp 0 0 192.168.1.1:80 192.168.1.5:51576 TIME_WAIT
tcp 0 0 192.168.1.1:80 192.168.1.5:51566 TIME_WAIT
How do I stop this? Oh no...