estesbubba
New Around Here
I got a RT-AC3100 and installed the Merlin firmware 382.1_2 after a day with it and it's been working great. I do have some questions and found a minor bug.
1. First the minor bug. Go to Traffic Analyzer -> Statistic and select show by Weekly. The graph actually shows the dates off by a day. Last date field shows today, but if you go into it and reselect today the graph is correct.
2. I enabled saving stats to a 2GB USB. What is the recommended USB size for stats?
3. Traffic Analyzer -> Traffic Monitor -> Global Monthly doesn't show any data. I've only been using Merlin for 3 days should I have any data here yet?
4. The iOS mobile app showed the real-time traffic stats on the Devices tab with the ASUS firmware but no longer does with Merlin. Didn't know if this is a bug, configuration issue on my end, or not possible with Merlin?
5. In Adaptive QoS my gauges were at 100M but now at 1000M. Since I have an 80/10 connection is there any way to change them back to 100M?
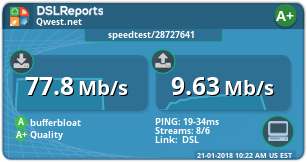
6. I have a solid 80/10 DSL connection with CenturyLink and get 1% above that when my internet is idle. I've been reading on Adaptive QoS and bufferbloat and have these settings for my DSL:
Type: Adaptive QoS
Bandwidth: Manual
Discipline: fq_codel
WAN overhead: 27, ATM unchecked (don't know if this should be or not)
Upload: 9.5 mbps (I would get more bufferbloat when set to 10)
Download: 79
Media Streaming mode (we use Vue TV)
Anything above I should change or looking at my results below should I call it good?
7. I see a lot of these in my log. I've read suggestions on other threads to try and stop it but no luck. Is there a known way to get rid or them or just ignore?
Jan 21 09:40:01 kernel: ERR[set_app_info_qos_meta:3361] It's a paid app, please assign a default bandwidth!
8. Sometimes when there is no traffic my CPU cores will go from 0-10% to 50-60% for a while. Is this normal?
Thanks for any suggestions!
1. First the minor bug. Go to Traffic Analyzer -> Statistic and select show by Weekly. The graph actually shows the dates off by a day. Last date field shows today, but if you go into it and reselect today the graph is correct.
2. I enabled saving stats to a 2GB USB. What is the recommended USB size for stats?
3. Traffic Analyzer -> Traffic Monitor -> Global Monthly doesn't show any data. I've only been using Merlin for 3 days should I have any data here yet?
4. The iOS mobile app showed the real-time traffic stats on the Devices tab with the ASUS firmware but no longer does with Merlin. Didn't know if this is a bug, configuration issue on my end, or not possible with Merlin?
5. In Adaptive QoS my gauges were at 100M but now at 1000M. Since I have an 80/10 connection is there any way to change them back to 100M?
6. I have a solid 80/10 DSL connection with CenturyLink and get 1% above that when my internet is idle. I've been reading on Adaptive QoS and bufferbloat and have these settings for my DSL:
Type: Adaptive QoS
Bandwidth: Manual
Discipline: fq_codel
WAN overhead: 27, ATM unchecked (don't know if this should be or not)
Upload: 9.5 mbps (I would get more bufferbloat when set to 10)
Download: 79
Media Streaming mode (we use Vue TV)
Anything above I should change or looking at my results below should I call it good?
7. I see a lot of these in my log. I've read suggestions on other threads to try and stop it but no luck. Is there a known way to get rid or them or just ignore?
Jan 21 09:40:01 kernel: ERR[set_app_info_qos_meta:3361] It's a paid app, please assign a default bandwidth!
8. Sometimes when there is no traffic my CPU cores will go from 0-10% to 50-60% for a while. Is this normal?
Thanks for any suggestions!
