Warlord1981
Regular Contributor
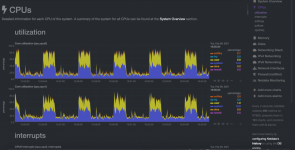
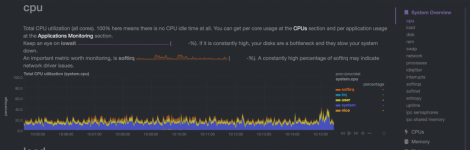
Hello everyone! Can you please help me understand & troubleshoot below 100% CPU spikes (mostly system, user & softirq) that happen repeatedly every 7 mins? Just installed Netdata and noticed this.
All network devices are idle during all this time, except very light browsing on one PC.
I have latest Voxel fw + Kamoj Addon latest version + Dncrypt v2 + Entware & Aegis on USB. No VPN.

All network devices are idle during all this time, except very light browsing on one PC.
I have latest Voxel fw + Kamoj Addon latest version + Dncrypt v2 + Entware & Aegis on USB. No VPN.
Last edited:
")