What's new

A possible bug with QOS traffic classification?

  • SNBForums Code of Conduct

    SNBForums is a community for everyone, no matter what their level of experience.

    Please be tolerant and patient of others, especially newcomers. We are all here to share and learn!

    The rules are simple: Be patient, be nice, be helpful or be gone!

Tomo123

Occasional Visitor
First of all, greetings and kindest regards to Merlin. Thank you for your work.

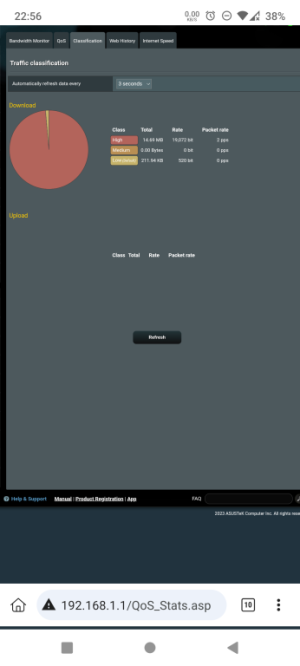
Now, onto the question at hand. I seem to have a small issue with traffic classification on the Adaptive QOS page ( the one with the pie chart ).

Sometimes, the page shows the pie chart with nothing under it ( as seen on the attached picture ), and sometimes ( under the pie chart ) it shows a list of connected clients, used ports and untracked traffic... then, after a few seconds, that list promptly disapears and I can not, for the life of me, get it back. Quite random. Only the lonely pie chart remains, ever vigilant.

Problem is, I would like that list back, or at least, to be shown the entire time under the pie chart where it proudly belongs.

Can someone help?

Router is AX86U Pro, latest Merlin firmware release ( 3004_388.5 ).

Thank you.
 

Attachments

  • Screenshot_20231209-225614.png
    Screenshot_20231209-225614.png
    35.9 KB · Views: 26
Sorry, did not mention I am using Traditional QOS.

EDIT: Is it expected to be fixed in the future ( under pie chart list and bandwidth gauges )?

Thank you for taking the time to reply.
 
What’s the output of tc qdisc
 
@dave14305
Here is the output:

Code:
ASUSWRT-Merlin RT-AX86U_PRO 3004.388.5_0 Sat Dec  2 17:49:53 UTC 2023
DELETED@RT-AX86U_PRO:/tmp/home/root# tc qdisc
qdisc noqueue 0: dev lo root refcnt 2
qdisc htb 2: dev imq0 root refcnt 2 r2q 10 default 0x40 direct_packets_stat 0 direct_qlen 11000
qdisc fq_codel 30: dev imq0 parent 2:30 limit 1000p flows 1024 quantum 300 target 5ms interval 100ms memory_limit 32Mb drop_batch 64
qdisc pfifo 60: dev imq0 parent 2:60 limit 11000p
qdisc fq_codel 40: dev imq0 parent 2:40 limit 1000p flows 1024 quantum 300 target 5ms interval 100ms memory_limit 32Mb drop_batch 64
qdisc fq_codel 20: dev imq0 parent 2:20 limit 1000p flows 1024 quantum 300 target 5ms interval 100ms memory_limit 32Mb drop_batch 64
qdisc pfifo_fast 0: dev eth0 root refcnt 2 bands 3 priomap 1 2 2 2 1 2 0 0 1 1 1 1 1 1 1 1
qdisc pfifo_fast 0: dev eth1 root refcnt 2 bands 3 priomap 1 2 2 2 1 2 0 0 1 1 1 1 1 1 1 1
qdisc pfifo_fast 0: dev eth2 root refcnt 2 bands 3 priomap 1 2 2 2 1 2 0 0 1 1 1 1 1 1 1 1
qdisc pfifo_fast 0: dev eth3 root refcnt 2 bands 3 priomap 1 2 2 2 1 2 0 0 1 1 1 1 1 1 1 1
qdisc pfifo_fast 0: dev eth4 root refcnt 2 bands 3 priomap 1 2 2 2 1 2 0 0 1 1 1 1 1 1 1 1
qdisc pfifo_fast 0: dev eth5 root refcnt 2 bands 3 priomap 1 2 2 2 1 2 0 0 1 1 1 1 1 1 1 1
qdisc pfifo_fast 0: dev spu_us_dummy root refcnt 2 bands 3 priomap 1 2 2 2 1 2 0 0 1 1 1 1 1 1 1 1
qdisc pfifo_fast 0: dev spu_ds_dummy root refcnt 2 bands 3 priomap 1 2 2 2 1 2 0 0 1 1 1 1 1 1 1 1
qdisc pfifo_fast 0: dev eth6 root refcnt 2 bands 3 priomap 1 2 2 2 1 2 0 0 1 1 1 1 1 1 1 1
qdisc pfifo_fast 0: dev eth7 root refcnt 2 bands 3 priomap 1 2 2 2 1 2 0 0 1 1 1 1 1 1 1 1
qdisc noqueue 0: dev br0 root refcnt 2
qdisc htb 1: dev ppp0 root refcnt 2 r2q 10 default 0x40 direct_packets_stat 0 direct_qlen 3
qdisc fq_codel 30: dev ppp0 parent 1:30 limit 1000p flows 1024 quantum 300 target 5ms interval 100ms memory_limit 32Mb drop_batch 64
qdisc pfifo 60: dev ppp0 parent 1:60 limit 3p
qdisc fq_codel 10: dev ppp0 parent 1:10 limit 1000p flows 1024 quantum 300 target 5ms interval 100ms memory_limit 32Mb drop_batch 64
qdisc fq_codel 40: dev ppp0 parent 1:40 limit 1000p flows 1024 quantum 300 target 5ms interval 100ms memory_limit 32Mb drop_batch 64
qdisc fq_codel 20: dev ppp0 parent 1:20 limit 1000p flows 1024 quantum 300 target 5ms interval 100ms memory_limit 32Mb drop_batch 64
DELETED@RT-AX86U_PRO:/tmp/home/root#
What about the output of nvram get wan_ifname

This is what Merlin checks for upload stats.

Are there any errors in your browser F12 console log?
 
Output is eth0, also no errors in the console log.

Do these things ( gauges and traffic classification ) even work on Traditional QOS without agreeing to Trend Micro stuff? I would hate to fully reset everything now that I have it dialed in.
 
Output is eth0, also no errors in the console log.

Do these things ( gauges and traffic classification ) even work on Traditional QOS without agreeing to Trend Micro stuff? I would hate to fully reset everything now that I have it dialed in.
The connection table won’t draw if it doesn’t detect the tdts module from TrendMicro. Not sure how it detects it, but Merlin seemed to expect it to work with other QoS configurations.

However, he doesn’t account for PPPoE connections for reporting upload stats.
 
I see. So, If gauges and traffic classification are expected to work, Trend Micro needs to be enabled. Since it is not enabled on my router, they do not work in my use case.

Glad to know that there are no underlying issues with the firmware that cause problems.

I just don't get why traffic classification sometimes flashes that list for a few seconds, then disappears...
 
I just don't get why traffic classification sometimes flashes that list for a few seconds, then disappears...
This was the issue I referred to earlier. When you click on "Adaptive QoS" in the GUI it takes you to the "Bandwidth Monitor" page. That automatically enables bwdpi even if you don't have TrendMicro stuff enabled. When you click way from that page by going to "Traffic classification" it tries to unload bwdpi but the data is still available for a few seconds.
 
Exactly what happens.

I tried Adaptive QOS, but returned to my usual Traditional QOS setup. After that, I kept wondering if I cocked something up, since there was no working Bandwidth Monitor anymore, while Traffic Clasification kept working for a few seconds, then dissapearing.

Only after turning on Trend Micro, it started to work properly. But, I have it off.
 
Is there anything in cat /proc/bw_cte_dump right now without any GUI activity?
 
I managed to do a bw_cte_dump right before gauges and traffic classification gave out, as you can see in the snip below.
XXXXXX@RT-AX86U_PRO:/tmp/home/root# cat /proc/bw_cte_dump
ipv4 tcp src=192.168.1.101 dst=104.26.0.220 sport=44792 dport=443 index=3 mark=80400000
ipv4 udp src=192.168.1.101 dst=142.250.180.228 sport=37229 dport=443 index=2 mark=80400000
ipv4 udp src=192.168.1.101 dst=142.250.180.228 sport=37229 dport=443 index=1 mark=80400000

After a refresh, gauges stopped working, and classification just left me with the pie chart ( my original issue ), hence "can't open" bit.

This is the result while being in GUI ( when stats dissapear ) and when fully logged off
XXXXX@RT-AX86U_PRO:/tmp/home/root# cat /proc/bw_cte_dump
cat: can't open '/proc/bw_cte_dump': No such file or directory

It seems that everything is working up to a moment when the router decides to unload anything related to gauges and traffic classification. Really at a loss here as why this happens. And it happens multie times in a row, until it disaapears for good.

Traditional QOS enabled, Trend Micro stuff is off. And when Trend Micro is enabled, everything works as it should. As I understand, those things should work even without Trend Micro. Please correct me if I am wrong.
 
Last edited:

Latest threads

Sign Up For SNBForums Daily Digest

Get an update of what's new every day delivered to your mailbox. Sign up here!
Top