What's new

High CPU Usage is back

  • SNBForums Code of Conduct

    SNBForums is a community for everyone, no matter what their level of experience.

    Please be tolerant and patient of others, especially newcomers. We are all here to share and learn!

    The rules are simple: Be patient, be nice, be helpful or be gone!

TheLyppardMan

Very Senior Member
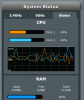
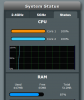
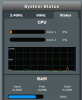
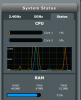
I've tried rebooting my RT-AC86U, but the high CPU usage problem persists. I've also tried disabling AiProtection and rebooting, as I had heard that might be relevant to the problem, but it didn't seem to make any difference. Here's the syslog since the reboot:-
I tried to upload the syslog file since the reboot as a text file but it wouldn't work and when I tried pasting in the text here, my post was blocked.
 

Attachments

  • Screenshot - 27_02_2020 , 11_06_55.png
    Screenshot - 27_02_2020 , 11_06_55.png
    29.3 KB · Views: 541
I would speculate that uiDivStats is causing your CPU issues once your dnsmasq.log files reach a certain size. They get reset to 0 on Saturday mornings, so things might work well for the first few days of the week, depending on your DNS activity/volume. Not a fault of uiDivStats, just a function of your network.

I could be wrong since a syslog doesn’t tell anything about CPU usage. Output from top when you have high CPU usage is required to really get to the root cause.
Sorry Dave but I don't know what you mean by "Output from top"; could you or someone else explain?
 
It's even worse now...
 

Attachments

  • Screenshot - 27_02_2020 , 17_28_44.png
    Screenshot - 27_02_2020 , 17_28_44.png
    21.8 KB · Views: 449
Well I've disabled Diversion and everything has now returned to normal.
 

Attachments

  • Screenshot - 27_02_2020 , 19_22_00.png
    Screenshot - 27_02_2020 , 19_22_00.png
    19.9 KB · Views: 416
I would perhaps try a different/faster USB drive.

Except for the first few minutes and after a reboot, I have not seen that on a variety of Asus routers.
 
Well I've disabled Diversion and everything has now returned to normal.
Maybe count ads runs only when stats are enabled. If you did not need stats, then maybe you could still have Diversion.

I have stats enabled and use uiDivStats. My Entware drive is a Samsung T5. I do notice CPU utilization from time to time, but only for a few seconds. I also have log-queries=extra enabled. My /opt/var/log/dnsmasq.log are between 3 and 40 MB.

Edit: You have an RT-AC86U which has a powerful CPU, so this is puzzling.
 
Last edited:
I'm puzzled because when I view the CPU usage via xShell, I don't see anywhere near the 100% spikes that the GUI is showing from time to time. By the way, this is with Diversion running but uiDivStats uninstalled.
 

Attachments

  • Screenshot - 27_02_2020 , 20_38_20.png
    Screenshot - 27_02_2020 , 20_38_20.png
    28.4 KB · Views: 419
  • Screenshot - 27_02_2020 , 20_39_29.png
    Screenshot - 27_02_2020 , 20_39_29.png
    73.4 KB · Views: 423
I'm puzzled because when I view the CPU usage via xShell, I don't see anywhere near the 100% spikes that the GUI is showing from time to time. By the way, this is with Diversion running but uiDivStats uninstalled.
Your top data showed more system CPU utilization than user utilization. So you really have to look at your idle percentage to see the inverse of the GUI info.
 
Your top data showed more system CPU utilization than user utilization. So you really have to look at your idle percentage to see the inverse of the GUI info.
Sorry Dave, but I don't fully understand what I need to do. What is the "idle percentage" you are referring to, where do I find it and with what do I compare it? Also, I still don't understand why the CPU usage when viewed through scMerlin differs so much from the CPU usage displayed in the GUI.
 
Maybe count ads runs only when stats are enabled. If you did not need stats, then maybe you could still have Diversion.

I have stats enabled and use uiDivStats. My Entware drive is a Samsung T5. I do notice CPU utilization from time to time, but only for a few seconds. I also have log-queries=extra enabled. My /opt/var/log/dnsmasq.log are between 3 and 40 MB.

Edit: You have an RT-AC86U which has a powerful CPU, so this is puzzling.
I've just checked and I don't see a dnsmasq.log file at the moment. Am I right in thinking I would need to enable logging before it appears and if so, what information would it contain that could help to diagnose this issue?
Screenshot - 28_02_2020 , 09_21_47.png
 
Sorry Dave, but I don't fully understand what I need to do. What is the "idle percentage" you are referring to, where do I find it and with what do I compare it? Also, I still don't understand why the CPU usage when viewed through scMerlin differs so much from the CPU usage displayed in the GUI.
I was referring to the top pdf you posted, this line:
Code:
CPU: 30.7% usr 66.8% sys  0.0% nic  0.0% idle  0.0% io  0.0% irq  2.3% sirq
It shows that only 30.7% of the CPU was being used by "user programs" and 66.8% were being used by "system stuff" likely related to those programs. And the idle % is 0 (percentage precedes the label). So the idle being zero would match the GUI utilization of 100%. And the sum of the individual processes may only match the user CPU%. (I understand it better than I can explain it, and that's not even anything to brag about!).
I've just checked and I don't see a dnsmasq.log file at the moment. Am I right in thinking I would need to enable logging before it appears and if so, what information would it contain that could help to diagnose this issue?
View attachment 21667
This is bizarre. How was uiDivStats doing anything when it was installed? Did the USB get wiped? Or is it the same USB as before?
 
  • Like
Reactions: a5m
I was referring to the top pdf you posted, this line:
Code:
CPU: 30.7% usr 66.8% sys  0.0% nic  0.0% idle  0.0% io  0.0% irq  2.3% sirq
It shows that only 30.7% of the CPU was being used by "user programs" and 66.8% were being used by "system stuff" likely related to those programs. And the idle % is 0 (percentage precedes the label). So the idle being zero would match the GUI utilization of 100%. And the sum of the individual processes may only match the user CPU%. (I understand it better than I can explain it, and that's not even anything to brag about!).

This is bizarre. How was uiDivStats doing anything when it was installed? Did the USB get wiped? Or is it the same USB as before?
I used a different USB flash drive and reinstalled everything from scratch. Thanks for the explanation of what the various figures mean.
 
I've disabled and then re-enabled Skynet and that seems to have solved the problem, at least for now.
Screenshot - 28_02_2020 , 20_48_19.png
 
I've just checked and I don't see a dnsmasq.log file at the moment. Am I right in thinking I would need to enable logging before it appears and if so, what information would it contain that could help to diagnose this issue?
View attachment 21667
My assumption is that Diversion's stats in general and counting of ads specifically are based on analysis of dnsmasq.log. The idea had been that diversion might be busy with an unusually large dnsmasq.log. Clearly that is not the case.
 

Similar threads

Latest threads

Sign Up For SNBForums Daily Digest

Get an update of what's new every day delivered to your mailbox. Sign up here!
Top