What's new

Traffic Monitor (Bogus Network Traffic Spikes) [SOLVED]

  • SNBForums Code of Conduct

    SNBForums is a community for everyone, no matter what their level of experience.

    Please be tolerant and patient of others, especially newcomers. We are all here to share and learn!

    The rules are simple: Be patient, be nice, be helpful or be gone!

Matteo Guglielmi

Regular Contributor
I'm running the latest firmware (378.55) on a RTAC68U router.

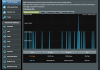
Every time I start the traffic monitor (Traffic Analyzer tab) I see network traffic flow anomalies in the form of "giant spikes" (see picture). Moreover the computed cumulative traffic (Total) makes simply no sense (16 GB in few seconds... I'd like it to be true!).

What could be causing such a weird behaviour?
 

Attachments

  • ScreenShot.png
    ScreenShot.png
    255.1 KB · Views: 759
Last edited:
Another picture with a spike two times bigger than all others... there's some kind of pattern here.
 

Attachments

  • ScreenShot2.png
    ScreenShot2.png
    200.5 KB · Views: 548
Last edited:
Please read the Note just above the graphic.
 
Please read the Note just above the graphic.
Yes, I changed that as well but it makes no difference whether it's turned on or off.

I've also tried to reset the router to the factory defaults without luck.

The only thing I can think of is that I'm forced to have double-NAT therefore the asus router is behind a primary router on which I have activated the DMZ function... but then, why would this screw up the network monitor?

EDIT: clearly something is wrong for the kernel reports correct values:

Code:
admin@RTAC68U:/tmp/home/root# ifconfig | grep "TX bytes"
  RX bytes:21138076 (20.1 MiB)  TX bytes:12647982 (12.0 MiB)
  RX bytes:124071037 (118.3 MiB)  TX bytes:69253695 (66.0 MiB)
  RX bytes:39198644 (37.3 MiB)  TX bytes:32752930 (31.2 MiB)
  RX bytes:2838900 (2.7 MiB)  TX bytes:99682445 (95.0 MiB)
  RX bytes:24907 (24.3 KiB)  TX bytes:24907 (24.3 KiB)
  RX bytes:952187 (929.8 KiB)  TX bytes:6091452 (5.8 MiB)
  RX bytes:0 (0.0 B)  TX bytes:0 (0.0 B)
  RX bytes:14511165 (13.8 MiB)  TX bytes:30068883 (28.6 MiB)
  RX bytes:0 (0.0 B)  TX bytes:0 (0.0 B)
 
Last edited:
It seems that asus itself corrected the problem (Fixed Traffic Analyzer GUI issue) with the latest firmware (3.0.0.4.378.9135).

RMerlin,

can you include the patch too so that I can try it out?
 
Last edited:
Well,

I'm testing your beta release (378.56_beta1) which is based on an even more recent asus firmware... issue seems gone.
 
Last edited:
Another picture with a spike two times bigger than all others... there's some kind of pattern here.
I confirm the same issue on 378.55, here's my screenshot. It happens only for tab1 (wan tab) and not for tabs 2-4.

I just experienced a major 5 minute router freeze, it was dropping 2.4 and 5Ghz and websites took 30 seconds to load. I thought it was a DDOS attack so I logged on to the router page > Traffic Analyzer and I saw the current, average, and maximum values on tab1(wan tab) to be ridiculous (in Gbps!) but they were only happening for outgoing (color: blue) and not for incoming, so it wasn't a DDOS. During this entire 5 minutes every device's connection came to a crawl, until it was over did was my network back to normal. I only recently updated to this firmware but it's definitely something unusual.
 

Attachments

  • tab2.png
    tab2.png
    193.2 KB · Views: 450
  • tab1_spikes.png
    tab1_spikes.png
    204.4 KB · Views: 665

Similar threads

Latest threads

Sign Up For SNBForums Daily Digest

Get an update of what's new every day delivered to your mailbox. Sign up here!
Top