What's new

Has anyone successfully used collectd to monitor temperature / thermal values ?

  • SNBForums Code of Conduct

    SNBForums is a community for everyone, no matter what their level of experience.

    Please be tolerant and patient of others, especially newcomers. We are all here to share and learn!

    The rules are simple: Be patient, be nice, be helpful or be gone!

develox

Regular Contributor
Hi to all,

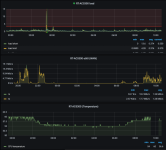
I've already in place a collectd-influxdb-grafana chain that monitors a few metrics (network, mem and load) on my Asus RT-AC5300.

I'm now in need to retrieve also the CPU thermal value. I've looked here in the forum: getting it via CLI is as simple as:
Bash:
cat /proc/dmu/temperature
followed by an awk that extracts only the first 2 chars from $4 (I can't seem to post it here without getting an error in the submission).
I know I could use the collectd:exec plugin but it's something I avoid when possible because of its resources requirements. But I can't seem to properly configure the collectd.thermal plugin.
If I just load it in the config (even without any config), I get:
Code:
plugin_load: plugin "thermal" successfully loaded.
Initialization of plugin `thermal' failed with status -1. Plugin will be unloaded.
plugin_unregister_read: No such read function: thermal
Error: one or more plugin init callbacks failed.
Exiting normally.

Adding a config section doesn't change the result.
Has anyone tried or succeeded at this ?
 
Last edited:
To share with anyone that might pass from here while in the same quest, I've meanwhile also read here in the forum and successfully tried the SNMP-way to collect the temp, by adding to snmp.add.conf and a shell script as needed. I also configured and SNMPv3 and tried successfully an SNMP walk/get. The problem is that, to my surprise by accidentally testing, and as I did read afterwards, enabling SNMPv3 indeed also enables SNMPv2 (i.e. you cannot have only SNMPv3 enabled with SNMPv2 disabled: you either get both versions, or none) defeating any security concern on that regard, and considering what you can get via SNMP ... I'll rather keep it disabled.
 
Thanks @amplatfus, I'll check it out !
I think it'd need some changes (the RT-AC5300 is not an HDN platform so the dev to monitor CPU temp is different, but the very same principle applies) also in order to make it send the metric directly to influx via curl perhaps (this would skip collectd altogether, but it might do).
 
Thanks @Yota that's exactly what I had done indeed, following the above idea of skipping collectd altogether. I ended up with this:

Bash:
/tmp/home/root# crontab -l | grep temp
* * * * * /jffs/scripts/temp.sh
where:
Bash:
/tmp/home/root# cat /jffs/scripts/temp.sh
#!/bin/sh
INFLUXDB_IP=192.168.1.15
INFLUXDB_PORT=8086
AWKSCRIPTPATH=/jffs/scripts/temp.awk
temp=$(cat /proc/dmu/temperature | cut -c19-20)
output=$(echo $temp | awk -f $AWKSCRIPTPATH)
echo $output | curl -i -XPOST "http://$INFLUXDB_IP:$INFLUXDB_PORT/write?db=collectd" --data-binary @- > /dev/null 2>&1
and:
Bash:
/tmp/home/root# cat /jffs/scripts/temp.awk
#!/bin/awk -f
BEGIN {
    FS=" "
    TEMP_CPU=0
}
{
    TEMP_CPU=$1
}
END {
    curtime = systime() * 1000000000
    printf "temperature,host=RT-AC5300 cputemp=%s %s", TEMP_CPU, curtime
}

It's not optimised as collectd would probably do, but it does its job in an apparently harmless way.
 
Last edited:
Hi,

Happy to see is working.
Please, this way of implementation is happening to write into MySQL on Entware in order to load a chart on local Entware web-server?

Thank you!
 
No, the curl command sends its data towards an InfluxDB server that's hosted on a linux box in my local network. The same host is running Grafana where various data from InfluxDB is represented.

For anyone interested it seems that in the setup of my specific router the major factor impacting the CPU temp is the radio status: enabling/disabling it increases/drops the CPU temp of roughy 4-5C. The screenshot above shows wireless scheduling turning it off at 10pm and on again at 7am. With a greatly empirical synthesis (and this very limited observation window), it looks like traffic and load doesn't have almost any impact compared to the radio status. Where anyway it must be observed that the load remained very low in this windows (average below 0.4, but even during plain daytime, with me fully home working and TV streaming from the web in HD, average load is about 0.5), despite running Suricata. Anyway, keeping the monitoring on will allow to look at it in any timeframe where load will spike (and CPU temp will most prabably be affected).
 

Attachments

  • Screenshot 2021-05-14 at 10.34.54.png
    Screenshot 2021-05-14 at 10.34.54.png
    472.9 KB · Views: 141
Last edited:
Welcome, and the previous command may output an error value when the cpu temperature over 100c.

You can use this command to make sure any values will be output normally
Code:
echo "$(cat /proc/dmu/temperature | tr -dc '0-9')"

And I recommend setting $AWKSCRIPTPATH to /tmp/temp.awk because jffs frequently write will accelerate the aging of router.
 
And I recommend setting $AWKSCRIPTPATH to /tmp/temp.awk because jffs frequently write will accelerate the aging of router.
He's reading that awk script not writing it. It's "temp" as in temperature, not as in temporary.
 
Welcome, and the previous command may output an error value when the cpu temperature over 100c.

You can use this command to make sure any values will be output normally
Code:
echo "$(cat /proc/dmu/temperature | tr -dc '0-9')"

And I recommend setting $AWKSCRIPTPATH to /tmp/temp.awk because jffs frequently write will accelerate the aging of router.
Correct for the temp with 3 figures (hopefully never, but in that case it wouldn't be handled), thanks.
Out of curiosity instead, isn't in this case the script path on jffs just read ? What gets written into there ?
 

Latest threads

Sign Up For SNBForums Daily Digest

Get an update of what's new every day delivered to your mailbox. Sign up here!
Top