Hi, folks!
Sorry for old thread resurrection, just need to insert my 5cents about how I got stats working:
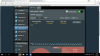
I have two remote routers running 384.5 RT-AC66U_B1 and RT-AC68U_WHITE and on the last one Statistic wasn't working like on screenshot in the first post.
Solution from Schoeps was not acceptable for me because the router is far away and there was nobody who can configure it after factory reset...
I discovered that data collection runs from hour_monitor in TrafficAnalyzer command which is symlink to bwdpi_sqlite (closed source).
Running TrafficAnalyzer from console shows error:
Code:
admin@faraway:/tmp/home/root# TrafficAnalyzer -e
traffic_analyzer_main: Traffic analyzer is disabled in software spec.
So I decided to discover which settings are fixed by factory reset.
Comparing nvram dump of both routers gives no result, so I had to see which settings are used by bwdpi code:
Code:
admin@workingstats:/tmp/home/root# (TrafficAnalyzer -e) &> /tmp/ta_strace
admin@workingstats:/tmp/home/root# grep -A 5 "/dev/nvram" /tmp/ta_strace | grep read | cut -d' ' -f2 | cut -d',' -f1| cut -d'"' -f2
;)\0\0
s\36\0\0
f8\0\0
Next I wrote a script to compare each setting reads from nvram with what I got:
Code:
admin@workingstats:/tmp/home/root# cat << EOF > /tmp/debug.sh
#!/bin/sh
(strace TrafficAnalyzer -e) &> /tmp/ta_strace
for key in $(nvram show|sort|cut -d"=" -f1)
do
   (strace nvram get $key) &> /tmp/try
   pattern="$(grep -A 5 "/dev/nvram" /tmp/try |grep read|cut -d' ' -f2|cut -d',' -f1|cut -d'"' -f2)"
   for target in $(grep -A 5 "/dev/nvram" /tmp/ta_strace|grep read|cut -d' ' -f2|cut -d',' -f1|cut -d'"' -f2)
   do
       if [ "$pattern" == "$target" ]
       then
           echo "GOT \"$pattern\" is $key"
       fi
   done
done
EOF
admin@workingstats:/tmp/home/root# chmod +x /tmp/debug.sh
admin@workingstats:/tmp/home/root# /tmp/debug.sh
GOT ";)\0\0" is productid
GOT "s\36\0\0" is odmpid
GOT "f8\0\0" is territory_code
Then I just compared this settings on routers
Code:
admin@workingstats:/tmp/home/root# for s in productid odmpid territory_code;do nvram get $s;done
RT-AC68U
RT-AC66U_B1
EE/01
Code:
admin@faraway:/tmp/home/root# for s in productid odmpid territory_code;do nvram get $s;done
RT-AC68U
RT-AC68U_WHITE
EU/01
And just changing odmpid to the right value fixed the statistics problem:
Code:
admin@faraway:/tmp/home/root# nvram set odmpid=RT-AC68U
admin@faraway:/tmp/home/root# TrafficAnalyzer -e
admin@faraway:/tmp/home/root#
Not sure odmpid changed after upgrading to 384.5 and haven't checked if stats working before, maybe asus had newer code in stock firmware or maybe they just forget to put "WHITE" model in known list of bwdpi_source, all in all, stats collecting fixed, I also think nvram settings preserved across reboots and power loss, if not, I'll add this to startup script...
Hope this helps somebody too..
Best regards
")

 ! Before there not even clientes or apps shown. However i am using a new client in the network and it dont show up yet. Is it to slow to update the client list ?
")