Hi guys,
i notice recently that my ax88u, running latest stable merlin wrt + diversion + skynet + uidivstats + transmission, behaves strange:
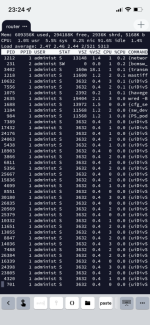
after reboot / power up, 4 cores report 0-1% load. The next day is 1-2%, the next one is 2-4% and etc.
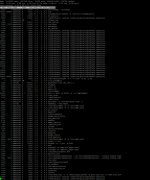
So after approx 2 weeks , cpu loads reach a state where kernel log reports errors , network degradation and router needs a reboot.
Any ideas why is this happening? How to solve it?
i notice recently that my ax88u, running latest stable merlin wrt + diversion + skynet + uidivstats + transmission, behaves strange:
after reboot / power up, 4 cores report 0-1% load. The next day is 1-2%, the next one is 2-4% and etc.
So after approx 2 weeks , cpu loads reach a state where kernel log reports errors , network degradation and router needs a reboot.
Any ideas why is this happening? How to solve it?