not there no more.Wanted to give this a try and install. What am I doing wrong?
jadmin@RT-AC86U-07F8:/tmp/home/root# curl --retry 3 "https://raw.githubusercontent.com/MartineauUK/vnstat/main/vnstat-install.sh" -o "/jffs/scripts/vnstat-install.sh" && chmod
755 "/jffs/scripts/vnstat-install.sh" && /jffs/scripts/vnstat-install.sh install
% Total % Received % Xferd Average Speed Time Time Time Current
Dload Upload Total Spent Left Speed
100 14 100 14 0 0 93 0 --:--:-- --:--:-- --:--:-- 105
/jffs/scripts/vnstat-install.sh: line 1: 404:: not found
jadmin@RT-AC86U-07F8:/tmp/home/root#
You are using an out of date browser. It may not display this or other websites correctly.
You should upgrade or use an alternative browser.
You should upgrade or use an alternative browser.
[Beta] VNSTAT on Merlin; CLI, UI and email data use monitoring (install script offline for now)
- Thread starter dev_null
- Start date
- Status
- Not open for further replies.
dev_null
Very Senior Member
The install script is offline, I'm sorry to say. I've reached out to @Martineau to discuss.Wanted to give this a try and install. What am I doing wrong?
jadmin@RT-AC86U-07F8:/tmp/home/root# curl --retry 3 "https://raw.githubusercontent.com/MartineauUK/vnstat/main/vnstat-install.sh" -o "/jffs/scripts/vnstat-install.sh" && chmod
755 "/jffs/scripts/vnstat-install.sh" && /jffs/scripts/vnstat-install.sh install
% Total % Received % Xferd Average Speed Time Time Time Current
Dload Upload Total Spent Left Speed
100 14 100 14 0 0 93 0 --:--:-- --:--:-- --:--:-- 105
/jffs/scripts/vnstat-install.sh: line 1: 404:: not found
jadmin@RT-AC86U-07F8:/tmp/home/root#
OK, Thanks. Hopefully this will be resolved soonThe install script is offline, I'm sorry to say. I've reached out to @Martineau to discuss.
So I installed this by hand, following the instructions (I think) at the github site and I'm getting data, but while the graphs are showing info, I'm not sure it's right... since the graph is showing data that doesn't match the command line output, and I've only been running it for a little over 3 hours:

I don't see where the data for hours 7 and 8 could've come from.
Code:
# vnstat --hours
eth0                                                                     13:18
  ^                                                                    r
  |                                                                    r
  |                                                                    r
  |                                                                    r
  |                                                                    r
  |                                                                    r
  |                                                                    r
  |                                                                 r  r
  |                                                                 r  r
  |                                                              rt rt r  rt
-+--------------------------------------------------------------------------->
  |  14 15 16 17 18 19 20 21 22 23 00 01 02 03 04 05 06 07 08 09 10 11 12 13

h  rx (MiB)   tx (MiB)  ][  h  rx (MiB)   tx (MiB)  ][  h  rx (MiB)   tx (MiB)
14        0.0        0.0 ][ 22        0.0        0.0 ][ 06        0.0        0.0
15        0.0        0.0 ][ 23        0.0        0.0 ][ 07        0.0        0.0
16        0.0        0.0 ][ 00        0.0        0.0 ][ 08        0.0        0.0
17        0.0        0.0 ][ 01        0.0        0.0 ][ 09       19.7       19.9
18        0.0        0.0 ][ 02        0.0        0.0 ][ 10      375.9      391.8
19        0.0        0.0 ][ 03        0.0        0.0 ][ 11    1,176.9      401.0
20        0.0        0.0 ][ 04        0.0        0.0 ][ 12    3,025.6      240.4
21        0.0        0.0 ][ 05        0.0        0.0 ][ 13      544.9      444.1
I don't see where the data for hours 7 and 8 could've come from.
dev_null
Very Senior Member
When vnstats launches initially, it doesn't seem to check the nvram time sync status, and so it may capture the initial few minutes of data under UTC. I've observed this effect most obviously when it's late EST and I reinstalled and it shows me data use for tomorrow (!). It should happen only on the initial collection (I haven't observed it after a reboot).So I installed this by hand, following the instructions (I think) at the github site and I'm getting data, but while the graphs are showing info, I'm not sure it's right... since the graph is showing data that doesn't match the command line output, and I've only been running it for a little over 3 hours:
I don't see where the data for hours 7 and 8 could've come from.
There is a setting in the vnstat.conf called TimeSyncWait which allows one to specify "how many minutes to wait during daemon startup for system clock to sync time if most recent database update appears to be in the future". But this doesn't apply to the initial boot because there is no data to reference.
But I think Entware doesn't launch until the time sync takes place--at least when set up under Diversion.When vnstats launches initially, it doesn't seem to check the nvram time sync status,
ColinTaylor
Part of the Furniture
Your command line output is from 13:18 which suggests the data set begins at ~10:00. Your image is from 08:13 and shows the 24 hours prior to that point. So I'm guessing the image is showing old data that you collected prior to deleting and recreating the database at ~10:00.and I've only been running it for a little over 3 hours:
I had not used vnstat prior to today. And the timestamps were probably messed up somewhat due to TZ not being set in my command line nor the startup script for vnstat. I've added the TZ setting now and appear to be getting reasonable data currently. Still don't know where the original "extra" data came from, but it wasn't from running vnstat previously.Your command line output is from 13:18 which suggests the data set begins at ~10:00. Your image is from 08:13 and shows the 24 hours prior to that point. So I'm guessing the image is showing old data that you collected prior to deleting and recreating the database at ~10:00.
QuikSilver
Very Senior Member
What's the easiest and cleanest way to remove the script and start over if needed?
For context I have two versions mounted.....Version 0.0.1 (alpha) and another version 0.9.1 (beta). Would like to either remove them both to start over or just remove the outdated alpha. Thanks!
Edit: Fixed, apparently rebooting it fixed the duplicate mounting version issues.
For context I have two versions mounted.....Version 0.0.1 (alpha) and another version 0.9.1 (beta). Would like to either remove them both to start over or just remove the outdated alpha. Thanks!
Edit: Fixed, apparently rebooting it fixed the duplicate mounting version issues.
Last edited:
dev_null
Very Senior Member
What's the easiest and cleanest way to remove the script and start over if needed?
For context I have two versions mounted.....Version 0.0.1 (alpha) and another version 0.9.1 (beta). Would like to either remove them both to start over or just remove the outdated alpha. Thanks!
Edit: Fixed, apparently rebooting it fixed the duplicate mounting version issues.
It's a good question nonetheless. For others desiring to remove, these steps should do it:
- Delete the scripts associated with vnstat in the
/jffs/scriptsand/jffs/add-onsdirectories. - Remove the cron jobs (
cru d job-name) - the job name is eithervnstat_dailyorvnstat_update - Remove the associated Entware packages (
opkg remove package-name) - Reboot
I am following this from Day1 and really look into getting this. But, i would like to know if at some point you'll have an integration into AMTM to get it installed/removed/updated?
Wouldn't that be up to the developer of amtm to decide to include it, not the developer of vnstat?
QuikSilver
Very Senior Member
Its up to both as @thelonelycoder has a standard that has to be met before he allows any scripts to be incorporated.Wouldn't that be up to the developer of amtm to decide to include it, not the developer of vnstat?
thelonelycoder
Part of the Furniture
@dev_null and I had a little chat a while agoIts up to both as @thelonelycoder has a standard that has to be met before he allows any scripts to be incorporated.
Jack Yaz
Part of the Furniture
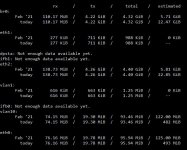
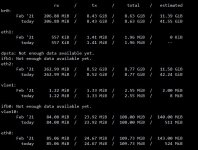
Looks like you might have misconfigured the interface in /opt/etc/vnstat.confWhy does CLI show all interfaces and not just the default. nvram get wan0_ifname shows vlan10 but why it shows all interfaces? Also looks like in my case data is going through br0 & eth2?
I
I put vlan10 there but if you look at the stats page, vlan10 is not showing much traffic although nvram get wan0_ifname shows vlan10.Looks like you might have misconfigured the interface in /opt/etc/vnstat.conf
dev_null
Very Senior Member
I don't see a specific flag for VLAN in the vnstat documentation. Not to say it can't but it would seem to need to be associated with an interface. At least that's appears to be how this version of vnstat works.@dev_null Does this work if VLAN tagging? Currently traffic analyzer doesn't work for daily and monthly usage with VLAN tagging. If I disable it and put another modem to connect to ISP first and use Asus as only as AP then traffic analyzer works but I prefer not to do that.
As Jack says, this would seem to be a configuration issue. The conf file should specify the primary iface. Can you describe your setup/connection?Why does CLI show all interfaces and not just the default. nvram get wan0_ifname shows vlan10 but why it shows all interfaces? Also looks like in my case data is going through br0 & eth2?
- Status
- Not open for further replies.
Similar threads
- Replies
- 7
- Views
- 3K
- Replies
- 1
- Views
- 640
- Replies
- 133
- Views
- 10K
- Replies
- 171
- Views
- 20K
Similar threads
Similar threads
-
-
-
New Script: TurboAsusSec (Beta)--Foray into the world of AI development
- Started by SolCutter
- Replies: 24
-
MerVLAN v0.52.93 Simple and Powerful VLAN Management **BETA**
- Started by r80xcore
- Replies: 171
-
AdGuardHome AX88U Pro and Merlin 3006.102.4 Beta AGH problem
- Started by Aqu
- Replies: 27
-
vnStat vnStat-on-Merlin v2.0.11 [2025-Nov-16] - Data Usage and Data Limit Monitoring using vnStat
- Started by Martinski
- Replies: 7
-
-
amtm LONG time Asus/Merlin, first time amtm -- reassurance please
- Started by David Cavalli
- Replies: 34
-
Entware Unsuccessful Entware installation on Asus RX-AX68U with Asuswrt-Merlin 3004.388.11
- Started by jt99999
- Replies: 7
-
Latest threads
-
-
-
Upgrading from an AX88U to AX88U Pro, can I used the non-pro as an AImesh node?
- Started by diyguy
- Replies: 2
-
Release ASUS RT-AX53U / RT-AX1800U Firmware version 3.0.0.4.386_69193 (2026/03/20)
- Started by fruitcornbread
- Replies: 0
-
Release ASUS RT-AX52 / Pro Firmware version 3.0.0.4.388_34015 (2026/03/20)
- Started by fruitcornbread
- Replies: 1
Support SNBForums w/ Amazon
If you'd like to support SNBForums, just use this link and buy anything on Amazon. Thanks!
Sign Up For SNBForums Daily Digest
Get an update of what's new every day delivered to your mailbox. Sign up here!
Members online
Total: 5,094 (members: 14, guests: 5,080)


