What's new

Buffer Memory slowly being consumed - 386.1_2 AX88U

  • SNBForums Code of Conduct

    SNBForums is a community for everyone, no matter what their level of experience.

    Please be tolerant and patient of others, especially newcomers. We are all here to share and learn!

    The rules are simple: Be patient, be nice, be helpful or be gone!

aex.perez

Senior Member
So a little background, AX88u and 2x AC5300 AIMESH all on 386.1_2. AX88u has (had just turned it off today on router, PC and NAS) jumbo frames enabled. Running several scripts Skynet, scMerlin, conmon, spdMerlin, dv-vnstat, ntpMerlin, scribe (monitoring AIMESH nodes as well), uiscribe, vpnmgr and YazDHCP, DDNS is enabled as well as Instant Guard. AIMESH nodes running scribe, scMerlin and LED control, wired backhaul. Trend micro permission withdrawn on AX88u. Everything running fine no real issues other than...

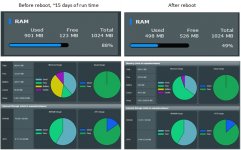
Buffer Memory (see attached pic) gets consumed slowly over time to the point that the router eventually becomes unstable impacting connectivity and requiring a reboot. This is new behavior and I have not been able to narrow down the cause as it occurs ever so slowly over time. In searching the forums I saw a few mentions of this cause by enabling Jumbo Frames, so I've just disabled that on every device in the network as a first step. Having upgraded the scripts and the fact this happens over time I have not been able to narrow down if one of them maybe causing this.

One other observation, running TOP on the router, the "nic" is constantly over 95%, hadn't noticed that before either but CPU is pretty low except when a automated Speedtest runs and just for the run.
Mem: 382340K used, 521248K free, 1516K shrd, 1352K buff, 60608K cached
CPU: 0.1% usr 0.3% sys 0.0% nic 99.4% idle 0.0% io 0.0% irq 0.0% sirq


Any thoughts on how to troubleshoot / where to look to find root cause.
 

Attachments

  • Router Memory before and after.jpg
    Router Memory before and after.jpg
    139.3 KB · Views: 232
The buffer memory usage increasing over time is perfectly normal behaviour, especially as you have so many add-ons installed. Each of them reads or writes to storage (e.g. log files, downloading block lists, etc.) and every block of storage will be buffered in memory until there is none left, at which point it will start discarding the oldest blocks. I would regard 88% memory usage as "healthy".
 
value precedes the label.....it's 99.4% idle....
Just realized that o_O - was a little preoccupied at the time I saw the stat
 
The buffer memory usage increasing over time is perfectly normal behaviour, especially as you have so many add-ons installed. Each of them reads or writes to storage (e.g. log files, downloading block lists, etc.) and every block of storage will be buffered in memory until there is none left, at which point it will start discarding the oldest blocks. I would regard 88% memory usage as "healthy".
Wasn't sure how that worked, glad it's normal behaviour. Was concerned about what I thought might be a problem and moving to B3 of 386.2 and making a false report/observation. Th attached was a preemptive reboot, the day of the instability memory usage was at 94%. Didn't get the scMerlin breakdown when it happened (during wife's telenovela/soap), next time, if there is a next time I will...
 
That's not to say there isn't a bug related to memory in some way. But in itself ~90% memory usage isn't that unusual.

I should correct my earlier statement though :oops:, file data blocks being "buffered" show up under the cached category. The buffers category is typically used for file system metadata. So the buffers usage is usually a lot smaller than cached unless you're reading or writing lots and lots of tiny files.

I would try disabling some of your add-ons and see if you can identify if there's a specific one that responsible for most of the buffer usage.

EDIT: I did find this post that points out that buffers will be used to cache raw disk IO as opposed to file data.
 
Last edited:
That's not to say there isn't a bug related to memory in some way. But in itself ~90% memory usage isn't that unusual.

I should correct my earlier statement though :oops:, file data blocks being "buffered" show up under the cached category. The buffers category is typically used for file system metadata. So the buffers usage is usually a lot smaller than cached unless you're reading or writing lots and lots of tiny files.

I would try disabling some of your add-ons and see if you can identify if there's a specific one that responsible for most of the buffer usage.

EDIT: I did find this post that points out that buffers will be used to cache raw disk IO as opposed to file data.
I'm on 386.2 B3 now, on the Router and the AIMESH its nodes. All else being equal to the original post. Dirty upgrade from 386.1_2 to 386.2 B3. The Memory stats on the main page vary between 53%-55%, where before it was so slowly increasing. Now it its back and forth within that small range. Buffers still seem to be increasing 0.01MB every few minutes. Going to let it run for a few days and see what happens. If it becomes a problem I'll start by removing scripts, newest ones added / updated first, and see what impact that has.

I don't believe any of the scripts I'm running would be writing "lots and lots of tiny files". Not sure whether log level / scribe / uiscribe / scribe on AIMESH nodes sending logs entries to Router and a couple of custom filters to keep things organized would account for that though... Running a Samsung USB 3.1 32GB and router config set for USB 3.0 operation in an attempt to avoid ever having Disk I/O performance problems.

In the short time I was putting this together. Buffers went from 11.64 MB to 12.11 MB but Cache dropped from 82.31MB to 80.93 MB
 
I may have found my problem...

Router:
Mem: 441240K used, 462320K free, 4016K shrd, 24100K buff, 84636K cached
CPU: 0.4% usr 0.8% sys 0.0% nic 98.6% idle 0.0% io 0.0% irq 0.0% sirq
Load average: 1.85 1.93 1.98 1/175 829
PID PPID USER STAT VSZ %VSZ CPU %CPU COMMAND
4314 4312 Master S 429m 48.6 1 0.0 syslog-ng


AIMESH #1:
CPU: 0.9% usr 1.2% sys 0.0% nic 97.1% idle 0.0% io 0.0% irq 0.5% sirq
Load average: 0.02 0.04 0.05 2/112 3300
PID PPID USER STAT VSZ %VSZ CPU %CPU COMMAND
2173 2172 Master S 17540 3.4 0 0.0 syslog-ng


AIMESH #2:
Mem: 91500K used, 423684K free, 944K shrd, 1284K buff, 11872K cached
CPU: 1.2% usr 0.5% sys 0.0% nic 97.6% idle 0.0% io 0.0% irq 0.5% sirq
Load average: 0.21 0.09 0.06 1/112 10239
PID PPID USER STAT VSZ %VSZ CPU %CPU COMMAND
2084 2083 Master S 17540 3.4 0 0.0 syslog-ng


Anyone else, running scribe, care to share the output of how much memory syslog-ng is using to compare - TOP command sorted, press shift + m after running the top command to sort by memory
 
Yes, scribe-ng always shows this memory usage. I have an AX88U and after a day or so it goes to <50MB free ram, but it isn't an issue, it is an efficient use of free memory for buffers and cache. Running for almost a month now on 386.2.alpha and memory is solid the same (ie. in use memory on the green pie chart stays the same). So, unless you are getting out of memory errors, be confident that this system is using the ram effectively to give good performance.
 
So far, the issues I saw in 386.1_2 with memory being consumed slowly, until there's none left, at which point, only a reboot would get things working again until the next out of memory condition. This behavior is not happening in 386.2 B3. Monitoring memory since moving to the beta and system status off the main page, it's been consistently in the 52% - 57% range overall and buffer memory a sliver compared to cache memory within scMerlin. Increasing then decreasing as usage/demand dictates as you might expect.

With 386.1_2 buffer memory only ever increased by varying amounts, never giving anything back until the router was out of memory necessitating a reboot to recover...
 

Latest threads

Sign Up For SNBForums Daily Digest

Get an update of what's new every day delivered to your mailbox. Sign up here!
Top