What's new
  • SNBForums Code of Conduct

    SNBForums is a community for everyone, no matter what their level of experience.

    Please be tolerant and patient of others, especially newcomers. We are all here to share and learn!

    The rules are simple: Be patient, be nice, be helpful or be gone!

scMerlin scMerlin 2.5.42 - Service and script control menu for Asuswrt-Merlin

Wow!
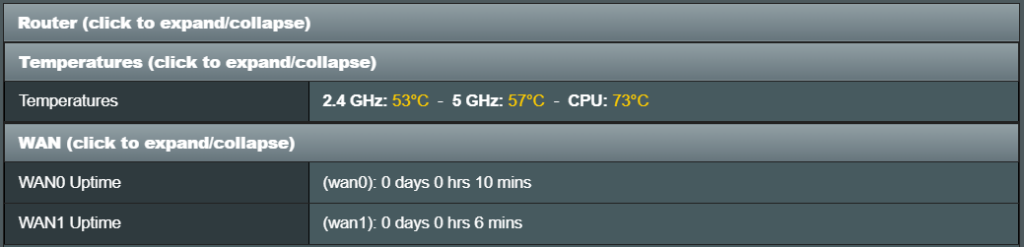
I'm shocked how much time, effort, collaboration, and testing it took to get the WAN Uptime feature working perfectly now!
I did see the feature when it got implemented back then, but to my bad, I never had time to test it since then. Anyhow, great work everybody, I'm jealous now!

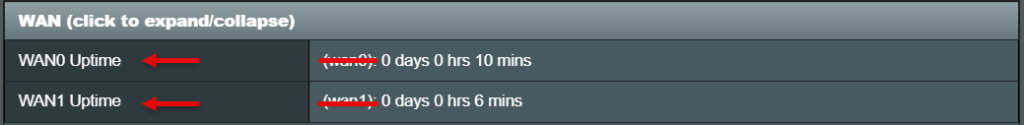
Now, I guess this is the last bit missing in the WAN Uptime feature, like a cake topping...
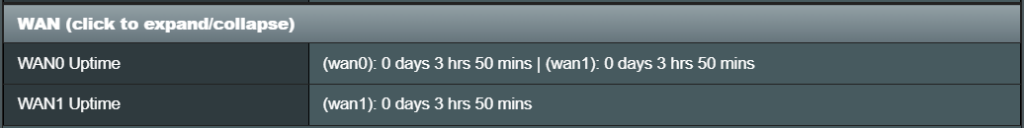
Recently, when I tried Dual WAN in load-balance mode for the very first time following my recent home network setup change, I found out that when both wan0 and wan1 are connected simultaneously, you get only one WAN reported with this feature (not sure which one exactly in different connection scenarios).

How about this last feature upgrade?

Can you confirm your output for this while in Load Balance mode?

Code:
nvram get wans_mode

Sorry as I don't have anything in Load-Balancing to test this myself.
 
Yeah, sure buddy! Here's the result:

Code:
# nvram get wans_mode
lb

I'll have something for you to test in half an hour or so in the development branch. Stand by as I tune it a bit more.
 
Thanks! I'll be available for more than this timeframe
 
Thanks! I'll be available for more than this timeframe

Hi @Tarek Yag

I'm ready for you to test, keep in mind I don't have a setup to test this with, if can you please give it a try and share your results and feedback (ideally screenshots if possible)

Run:
Code:
sh /jffs/scripts/scmerlin develop

Thanks!
 
Testing to ensure it's still working for those not using dual WAN (because I can).
1000020930.png
 
Testing to ensure it's still working for those not using dual WAN (because I can).
View attachment 67751

Trust me I have zero issues with the additional testing! Much appreciated actually!

The goal is never to cause any regression issues. However Martinski has proven to me on many occasions in his code reviews, it's easier to be caught off guard than you might expect!
 
if can you please give it a try and share your results and feedback (ideally screenshots if possible)
Yeah that's for sure! All screenshots attached...

1. Just tested it immediately after update, it produced the expected output
2. Unplugged my WAN1 cable to reset the timer and check if output updates correctly, it did show (wan0) only, great!
3. Plugged-in my WAN1 cable again, (wan1) showed up again in the output with 0 minutes, great!

Note 1:
Do you agree with me that it would be cosmetically better to show each WAN status in a separate line instead of seperating both with a " | " sign?
Note 2:
Would you please correct the capitalization of "WAN uptime" in the Web GUI to match the CLI (WAN Uptime)?

Thanks a lot!
 

Attachments

  • 2025-09-04_08-57-38.png
    2025-09-04_08-57-38.png
    27.8 KB · Views: 21
  • 2025-09-04_08-58-00.png
    2025-09-04_08-58-00.png
    28.5 KB · Views: 19
  • 2025-09-04_09-01-02.png
    2025-09-04_09-01-02.png
    23 KB · Views: 20
  • 2025-09-04_09-01-25.png
    2025-09-04_09-01-25.png
    27 KB · Views: 19
  • 2025-09-04_09-03-42.png
    2025-09-04_09-03-42.png
    27.6 KB · Views: 27
As a forum post limitation, I wasn't able to upload the fifth and last attachment, so here it is...
 

Attachments

  • 2025-09-04_09-04-16.png
    2025-09-04_09-04-16.png
    28.4 KB · Views: 24
Yeah that's for sure! All screenshots attached...

1. Just tested it immediately after update, it produced the expected output
2. Unplugged my WAN1 cable to reset the timer and check if output updates correctly, it did show (wan0) only, great!
3. Plugged-in my WAN1 cable again, (wan1) showed up again in the output with 0 minutes, great!

Note 1:
Do you agree with me that it would be cosmetically better to show each WAN status in a separate line instead of seperating both with a " | " sign?
Note 2:
Would you please correct the capitalization of "WAN uptime" in the Web GUI to match the CLI (WAN Uptime)?

Thanks a lot!

I do agree.

Looking at my implemented code now, it's pretty clear that its better to have it on its own separate lines. (Both in SSH and on the webUI page)

I'll start poking at that this evening after work. I'm just happy to see the "nuts and bolts" logic is working behind the scenes.

Tidying up the rest up should be a fairly easy task 😉
 
@Tarek Yag

Please try again after running:

Code:
sh /jffs/scripts/scmerlin develop

As always I would appreciate your detailed documentation along with screenshots if anything appears out of place.
It should now appear like this in the WebUI:

Snag_1bcf16e0.png


This addresses your two reports:
1. Show each interface on it's own row
2. Fix capitalization on the interface rows

I cannot grab a screenshot of how it will display in SSH as I don't have Dual-WAN, but it should also display over two lines now.
Thanks!
 
Please try again after running
I started some experimenting with your code just a few minutes after you posted this reply.

As always I would appreciate your detailed documentation along with screenshots
I'm glad you like my detailed feedback!

It should now appear like this in the WebUI:
Unfortunately, your latest update totally messed up the display at the GUI, you need to make another change to get it to work correctly.
But first please take a look and maybe adopt the suggested CLI look that I made (copied from within the script).
Screenshots for the resulting GUI change and my suggested vs the recent CLI looks are attached.

I cannot grab a screenshot of how it will display in SSH as I don't have Dual-WAN, but it should also display over two lines now.
This was the very first thing I experimented with, then found out that it is actually what is sent to the Webpage later.
 

Attachments

  • 2025-09-05_06-48-21.png
    2025-09-05_06-48-21.png
    37.5 KB · Views: 19
  • 2025-09-05_06-50-53.png
    2025-09-05_06-50-53.png
    30.6 KB · Views: 17
  • 2025-09-05_06-53-32.png
    2025-09-05_06-53-32.png
    31 KB · Views: 27
Last edited:
Hi @Tarek Yag

Thanks for the feedback and the DM message with some look and feel changes for the SSH / CLI view.
I feel obligated to re-enforce the fact that I am running blind on 2 counts.

1. One is that I simply do not have the means to setup a Dual WAN on my end...
2. Your running an older AC router which does not have the regular wan1_uptime nvram values populated like our newer BE routers. As you already mentioned here:
This was the very first thing I experimented with, then found out that it is actually what is sent to the Webpage later.
This is actually the fallback method for the older AC/AX routers since they miss the nvram values and we instead output to /www/ext/scmerlin/wanuptime.js
I happen to know this as I'm the one that originally wrote that fallback method when testing the original solution (which Martinski then cleaned up)

This means it's hard for me to troubleshoot without logs or screenshots and I'm running blind without the setup to test.
All this to say I do appreciate the screenshots and feedback whenever you can provide them, but to please bare with me as this feature is developed in real time.

Let me know how it works after the latest tweaks I've made to correctly split the data up in the AJAX fallback method.
Code:
sh /jffs/scripts/scmerlin develop
 
Last edited:
I feel obligated to re-enforce the fact that I am running blind on 2 counts.
No worries, you did great! And thanks for taking the explanation to public.

All this to say I do appreciate the screenshots and feedback whenever you can provide them, but to please bare with me as this feature is developed in real time.
Anytime! I love good collaboration in a real teamwork.

I just finished testing from scratch (Single WAN 0 and 1 connected sequentially, and Dual WAN connected simultanuously). Everything is working fine and displaying nicely both in CLI and GUI. Great work! Here's your screenshots from the latest "develop" branch update.
 

Attachments

  • 2025-09-05_09-22-44.png
    2025-09-05_09-22-44.png
    71.6 KB · Views: 26
  • 2025-09-05_09-23-00.png
    2025-09-05_09-23-00.png
    30 KB · Views: 33
Let me know how it works after the latest tweaks I've made to correctly split the data up in the AJAX fallback method.
I don't know if I'm asking for too much.. But, cosmetically again, and I understand it's annoying doing it with the AJAX fallback method, but it would be better looking if you can get rid of the "(wan*): " string off the cell content in the GUI as the header cell to its left already contains the needed information (WAN* Uptime).

Screenshot attached for demonstration
 

Attachments

  • 2025-09-06_04-21-17.png
    2025-09-06_04-21-17.png
    33.7 KB · Views: 22
This is actually the fallback method for the older AC/AX routers since they miss the nvram values and we instead output to /www/ext/scmerlin/wanuptime.js
I happen to know this as I'm the one that originally wrote that fallback method when testing the original solution (which Martinski then cleaned up)

This means it's hard for me to troubleshoot without logs or screenshots and I'm running blind without the setup to test.
All this to say I do appreciate the screenshots and feedback whenever you can provide them, but to please bare with me as this feature is developed in real time.

Let me know how it works after the latest tweaks I've made to correctly split the data up in the AJAX fallback method.

Not sure if I'm misunderstanding (as usual) where you have gotten to in development @ExtremeFiretop as I've not had my eye on this thread for a week or so but I just tried latest development version and after a reboot etc get no uptime showing for my WAN1, even though it is very much alive :)

RT-AX86U, running in Dual WAN Failover, WAN1 is a 5G device plugged in via ethernet (not USB) on LAN Port 4. Details as per my signature.

Screenshot 2025-09-06 at 12.24.34.png


All showing "alive" in @Ranger802004 wan-failover script status ...

Let me know if you want anything tested?
 
RT-AX86U, running in Dual WAN Failover, WAN1 is a 5G device plugged in via ethernet (not USB) on LAN Port 4. Details as per my signature.
In Failover/Failback mode you don't get both WANs connected at the same time like in load-balance mode. Hence, you'll find only one WAN connected at any given time.

All showing "alive" in @Ranger802004 wan-failover script status ...
I guess its very normal for your WAN1 to be reported as alive in Ranger's script because it actively monitors both WANs simultaneously.

I just tried latest development version and after a reboot etc get no uptime showing for my WAN1
I very much believe it's just a cosmetic issue caused by the recent display changes for load-balance mode. I'm trying here to cut diagnosing time for our dear developers, can you confirm that you don't get this view in the stable release?
 
In Failover/Failback mode you don't get both WANs connected at the same time like in load-balance mode. Hence, you'll find only one WAN connected at any given time.
Ok, fair enough @Tarek Yag, and thanks for all your diagnosis in moving this along - I take the fact that it's shown as "Hot Standby" (and the wan-failover script's ability to monitor it) as meaning it is "up" but just not actively "in use". Also, since I can "ping" out of it to an external address ... isn't it "connected"? Guess it comes down to semantics a bit ...

Via WAN0 (eth0)

Code:
admin@AsusRouter:/jffs/scripts# ping -I eth0 cloudflare.com
PING cloudflare.com (104.16.132.229): 56 data bytes
64 bytes from 104.16.132.229: seq=0 ttl=251 time=14.725 ms
64 bytes from 104.16.132.229: seq=1 ttl=251 time=12.082 ms
64 bytes from 104.16.132.229: seq=2 ttl=251 time=10.646 ms
64 bytes from 104.16.132.229: seq=3 ttl=251 time=10.287 ms

Via WAN1 (eth1)

Code:
admin@AsusRouter:/jffs/scripts# ping -I eth1 cloudflare.com
PING cloudflare.com (104.16.132.229): 56 data bytes
64 bytes from 104.16.132.229: seq=0 ttl=55 time=25.400 ms
64 bytes from 104.16.132.229: seq=1 ttl=55 time=66.067 ms
64 bytes from 104.16.132.229: seq=2 ttl=55 time=65.794 ms
64 bytes from 104.16.132.229: seq=3 ttl=55 time=65.906 ms

Note the much longer latency via the 5G backup device, which is how I'm pretty sure it isn't going out via my main HFC connection.

So in terms of addressing my concept of "uptime" when referring to WAN1, I think well it's "up".
Not argung, just confused (as usual).

😃

I'm trying here to cut diagnosing time for our dear developers, can you confirm that you don't get this view in the stable release?
Correct, I don't see the extra line for WAN1 at all, which I guess is fine as per that logic - single line display then changes to WAN1 if I "failover", as per my earlier messages in this thread. I guess ideally scMerlin would show the two lines with uptimes for WAN0 and WAN1, and then some kind of marker (maybe an asterisk or something?) indicating which was actually the active WAN? But maybe that's not possible on the older routers like mine ... or indeed at all?
 
Last edited:
I take the fact that it's shown as "Hot Standby" (and the wan-failover script's ability to monitor it) as meaning it is "up" but just not actively "in use".
Well, here's the whole thing!
"Hot Standby", which is clearly visible to you in your Network Map, doesn't count as "Connected" as you already guessed. Although it is indeed physically connected, and you can ping a target through it, and WAN Failover script successfully monitors it, but it is not considered connected until it gets "in use" as you said, hence, no uptime.

Not argung, just confused (as usual).
Haha, you're fine, it happens!

I guess ideally scMerlin would show the two lines with uptimes for WAN0 and WAN1, and then some kind of marker (maybe an asterisk or something?) indicating which was actually the active WAN?
Actually not, because as I said now, there's no uptime whatsoever for the not "Connected" WAN. So it's a display issue only. The correct display is what you can see in the current stable release of the script.
I guess @ExtremeFiretop might need to fix this now, ideally as I already suggested to him yesterday regarding how to display the uptimes in the webpage specifically.

But maybe that's not possible on the older routers like mine ... or indeed at all?
No, I guess it has nothing to do with your router being old or new. Mine is ancient!
 
Actually not, because as I said now, there's no uptime whatsoever for the not "Connected" WAN. So it's a display issue only. The correct display is what you can see in the current stable release of the script.
I also get this though on the development version when I failover, whereas I would have expected a low number for WAN1, as in counting from when it "took over"?
Probably just display issues as you say?

Screenshot 2025-09-06 at 15.16.15.png


Screenshot 2025-09-06 at 15.17.29.png


No doubt @ExtremeFiretop will chime in and clarify all this and tell me what an idiot I am...

😃
 

Latest threads

Support SNBForums w/ Amazon

If you'd like to support SNBForums, just use this link and buy anything on Amazon. Thanks!

Sign Up For SNBForums Daily Digest

Get an update of what's new every day delivered to your mailbox. Sign up here!
Back
Top