What's new

[Solved] High RAM usage RT-AX88U, question.

  • SNBForums Code of Conduct

    SNBForums is a community for everyone, no matter what their level of experience.

    Please be tolerant and patient of others, especially newcomers. We are all here to share and learn!

    The rules are simple: Be patient, be nice, be helpful or be gone!

That’s not what happening. Memory fills, not with caching, doesn’t release when needed, processes start swapping, cpu chokes, router near bricks, performance gone. Even if it was caching, then it’s a less than optimal implementation, as it never gives back to the system when needed. If not caching, once boot completes, memory consumption should not increase.
So one way or the other it’s wrong, as the end result should not be a router being brought to it’s knees after 5-7 days
If that's the case then your problem is not the same as that being discussed in this thread, which is just normal memory management.

Use the commands previously mentioned to determine the source of the problem and report it in the relevant thread.
 
First, a couple of things:

1. It's impossible to search for "RAM" because SmallNetBuilder's forum search blocks keywords that are too short. This probably leads to additional threads. Not the user's fault; that's something the site admin needs to fix.
2. It's not helpful or productive to go around telling people they "don't understand" Linux memory management; that's just condescension and mockery.

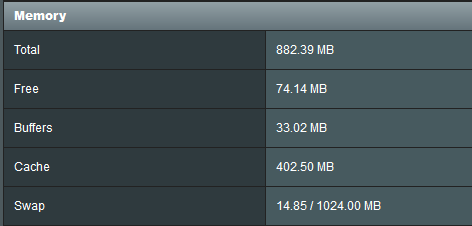
Now I bumped this thread because I, too, have this problem with an RT-AX88U running 384.17. After a reboot, the RAM usage is about 500MB. Over the course of a 1-2 weeks, the RAM usage climbs slowly until it hits ~99% and WAN performance suffers. LAN performance remains unaffected. A typical speed test for me yields 10ms, 200Mbps down, 22Mbps up. When the RAM is maxed out, the pings are all over the map and throughput plummets to about 30Mbps, 10Mbps up.

Just a wild guess ... but I think this is a memory leak from there is a table that stores a recent list of WAN connections from LAN clients, and it's failing to release memory when these connections are closed. Once the RAM hits 99% and this table is full, the router must make a decision about how to handle additional connections and this causes a slowdown. Not sure if it's hitting swap space (in RAM) or just waiting until the connections are purged.

Has anyone else observed such a memory leak? Is there anything in the code that *might* lead to a memory leak? One would need a lot of devices on the LAN (I have ~30 right now) and also share a lot of "Linux ISOs" to generate this level of activity.

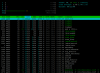
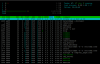
The top RAM consuming processes on my RT-AX88U are as follows:

Code:
Mem total:903572 anon:32452 map:15656 free:484176
 slab:271444 buf:0 cache:26728 dirty:0 write:0
Swap total:0 free:0
  PID   VSZ VSZRW^^^RSS^(SHR) DIRTY (SHR) STACK COMMAND
 1275  9064  4584  5872  1524  4296     0   132 networkmap --bootwait
    1 13636  2008  5056  3076  1784     0   144 /sbin/init
 1171 10308  1848  5044  2736  1580     0   132 httpd -i br0
 1278 10164  1532  3956  2624   556     0   132 mastiff
 1539 34384 17992  3948  2208   960     0   132 /usr/lib/ipsec/charon --use-syslog
 1359 60640 42688  3568  2788   780     0   132 amas_lib
 1179 12608   980  3380  2800   576     0   132 watchdog
 3548 12608   980  3376  2836   532     0   132 bwdpi_wred_alive
 1308 20820  7396  3340  2708   620     0   132 roamast
 1682 12608   980  3300  2768   532     0   132 disk_monitor
 1310 14656  3024  3292  2748   540     0   132 conn_diag
 1521 12608   980  3208  2688   520     0   132 usbled

If you are having this problem, log in via ssh and run the "top" command. Press the "S" key repeatedly until you see ^^^RSS^ indicating memory is being sorted by Real (memory) Size. Then paste your results.

This is busybox's version of "top," a stripped down variant of the top command you know from Ubuntu, Redhat, and BSD varieties like MacOS.

Finally, I'm just one systems engineer who knows how to use the tools but not necessarily what to look for. We could use some input from rmerlin.
 
Last edited:
Same issue here. 384.18

it was 90%+ memory usage in last few weeks, found this thread, rebooted, now it's 46% in use (48% after 18 mins after reboot), htop in attachment, top is below.
it's pretty strange. there were no such issues with memory leaks on previous FWs, and there were no such issues with AC-88U, my uptime was between every new FW release
@theirongiant

Code:
Mem total:903572 anon:27572 map:13456 free:549248
 slab:271348 buf:4624 cache:26400 dirty:0 write:0
Swap total:2097148 free:2097148
  PID   VSZ VSZRW^^^RSS^(SHR) DIRTY (SHR) STACK COMMAND
 1164 10532  2064  5696  3260  1688     0   132 httpds -s -i br0 -p 99
 1203  8568  4084  5232  1492  3688     0   132 networkmap --bootwait
    1 13628  1996  4816  2904  1764     0   140 /sbin/init
 1237 20824  7396  3368  2708   644     0   132 roamast
 1286 27860 15308  3360  2748   612     0   132 amas_lib
 1165  9448  1080  3336  2888   448     0   132 httpd -i br0
 1175 12612   980  3328  2748   576     0   132 watchdog
 1709 12612   980  3292  2756   532     0   132 disk_monitor
 1239 14660  3024  3200  2656   540     0   132 conn_diag
 1213 12612   980  3196  2640   556     0   132 pctime
 1066 12612   980  3184  2608   564     0   132 /sbin/wanduck
 1381 12612   980  3172  2652   520     0   132 usbled
 1240 12612   980  3156  2620   532     0   132 erp_monitor


For Virtual size:
Code:
Mem total:903572 anon:27676 map:13460 free:549200
 slab:271488 buf:4624 cache:26404 dirty:0 write:0
Swap total:2097148 free:2097148
  PID^^^VSZ^VSZRW   RSS (SHR) DIRTY (SHR) STACK COMMAND
 1286 27860 15308  3360  2748   612     0   132 amas_lib
 1237 20824  7396  3368  2708   644     0   132 roamast
  321 18524 16724   844   628   112     0   132 /bin/swmdk
 1239 14660  3024  3200  2656   540     0   132 conn_diag
 1088 14660  3024  2872  2348   524     0   132 /sbin/netool
    1 13628  1996  4816  2908  1764     0   140 /sbin/init
 4476 12964  1024  2896  2748   592   480   132 /sbin/wanduck
 1175 12612   980  3328  2748   576     0   132 watchdog
 1066 12612   980  3184  3088   564   480   132 /sbin/wanduck
 1213 12612   980  3196  2640   556     0   132 pctime
 1176 12612   980  3068  2528   536     0   132 check_watchdog
 1240 12612   980  3156  2620   532     0   132 erp_monitor
 1709 12612   980  3292  2756   532     0   132 disk_monitor
 1179 12612   980  3068  2548   520     0   132 sw_devled
 1381 12612   980  3172  2652   520     0   132 usbled
 1207 12612   980  3008  2492   516     0   132 bwdpi_check
  935 12612   980  2684  2172   512     0   132 console
 1125 12612   980  2924  2412   512     0   132 wpsaide

Code:
:/tmp/home/root# free
             total       used       free     shared    buffers     cached
Mem:        903572     355084     548488       1504       4624      26420
-/+ buffers/cache:     324040     579532
Swap:      2097148          0    2097148

@RMerlin any thoughts?
 

Attachments

  • mu.PNG
    mu.PNG
    211.3 KB · Views: 181
  • mu2.PNG
    mu2.PNG
    183.4 KB · Views: 185
Last edited:
it was 90%+ memory usage in last few weeks, found this thread, rebooted, now it's 46% in use (48% after 18 mins after reboot),
That level of memory usage is perfectly normal if you have a USB drive attached to your router. You are also running the router's media server which will eat up memory for disk cache.

If you are actually experiencing an issue that you suspect is memory related you need to post the information from when it is occurring. Posting information having rebooted the router isn't particularly useful.

@ColinTaylor
yeah, I understand. sorry for offtopic.
thanks for clarifying regarding USB drive, but anyway I don't have any dlna or any other media server installed on this..
 
I have also noticed increased memory usage on this firmware compared to .17

Media server is not in use in my case since I run them from my HTPC in my setup.


On the 384.17 firmware my cache would usually sit around 300 MB and I never hit swap file usage.

Everything is running fine so not an issue but is something I noticed when compared to the previous firmware.
 
Did you possibly install uiDivStats?

A few weeks ago version 2 came with a lot of changes.

In my case, I can watch how more and more RAM is used every hour after installing / upgrading to v2.
For me it's about 1-2% per hour ... and it doesn't stop.

Without uiDivStats (version 2) everything is fine.

Yes I run this script.

Thanks for the heads up.
 
Got this issue on the ac5300
After reboot 349mb around 60%, 5days later 490mb 99%
Don’t care that you can swap it out. The point is it looks like a memory leak, it should not grow
All services running after boot being 349mb, should not slowly flood into nearly 500mb with logging off after a couple of days. this is amtm diversion skynet only. Once you reach 99% processor utilisation gets through the roof and a reboot is needed
I also suspect that I am seeing a memory leak on my AC-5300, currently on 384.17. RAM usage slowly but steadily increases until the WebUI becomes unresponsive and Internet connectivity breaks. There is no process to which I can associate the usage via a top command. I don't have any additional scripts installed through amtm and don't have any of the USB services applications enabled. I do have an OpenVPN server configured though infrequently use it. I do run wireless in Tri-Band Smart Connect and 802.ad bonding to a managed switch which all the wired connections use.
 
Why are you running 384.17 today? Time to upgrade.
 
I already have the 384.18 files downloaded, just waiting for a backup-to-cloud job to finish in hopefully the next couple days; it's been running about three weeks.
 
Got this issue on the ac5300
After reboot 349mb around 60%, 5days later 490mb 99%
Don’t care that you can swap it out. The point is it looks like a memory leak, it should not grow
All services running after boot being 349mb, should not slowly flood into nearly 500mb with logging off after a couple of days. this is amtm diversion skynet only. Once you reach 99% processor utilisation gets through the roof and a reboot is needed

Exact same issue with my Rt-Ac5300, the fix is to turn off Ai protect.
 
I've never used AI protection and the usage is still high so that isn't a fix for all.
 
After upgrading the rt-ax88u to firm 384.18 (dirty upgrade) the RAM usage increased. Using Diversion, Skynet, Unbound manager, scribe and uidivstats .... after a reboot the RAM starts around 67% but in just one day is around 97%. I don’t have AI protection enabled
 
hello i also have an asus rt-ac5300 and i have the same things :D by me i can see when skynet or division is activating the ram goes up after reboot and a few seconds
 

Sign Up For SNBForums Daily Digest

Get an update of what's new every day delivered to your mailbox. Sign up here!
Top