What's new

MoCA PHY Rates question

  • SNBForums Code of Conduct

    SNBForums is a community for everyone, no matter what their level of experience.

    Please be tolerant and patient of others, especially newcomers. We are all here to share and learn!

    The rules are simple: Be patient, be nice, be helpful or be gone!

Leecm0365

Occasional Visitor
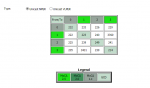
I have been playing around with my newly setup MOCA network and have a question regarding the PHY rates chart from one of the GoCoax adapters. See attachment showing my network. When I look at the PHY Rates between Network 1 GoCoax adapters going from the TP Link router to the netgear R8000P router I see 689 and 701 in the green shaded area and 3500+ in the white squares. When I look at the PHY chart for the network 2 GoCoax adapters running from the TP Link router to the Belkin Router the PHY rates are all around 214 -249 in the lite green shaded areas and 3500+ from/to the bright green squares.

My question is why are the lite green shaded areas associated to the bright green squares associated to network 2 so much less than the lite green shaded areas for network 1? Should they be?

Network.png


GoCoax-PIC-2.PNG


GoCoax-PIC1.PNG
 

Attachments

  • GoCoax-PIC1.PNG
    GoCoax-PIC1.PNG
    13.1 KB · Views: 314
looks as expected to me. The gocoax modems in both network are talking to each other at about 3400 which is full speed for moca2.5.
The other devices in network 2 look like they may support moca1.0 or 1.1.

if you want to test actual transfer speeds, use iperf and two computers on the network. Do some searching in this forum to get the command line to use with parallel streams. Otherwise, the transfer rate will look abysmal. MOCA was set up to allow multiple devices to communicate in parallel across the coax. When you just do a file or directory copy across the moca network, it will look slow. If you have multiple devices doing that at the same time, then you will see the total throughput.
 
Thank you for the response, I was focused GCD values where network 1 GCD values 689 and 701 for GoCoax adapters and on network 2 the values are 223 and 214 for the 2 GoCoax adapters. It is my understanding the GCD values are the actual bit rate while PHY values are what it could be. I’m a newbie and not fully understanding what the data in the tables are telling.

I have Verizon with 200/200 service, I do see a difference in speeds between network 1 and network 2. What I mean by this is if I connect wirelessly to belkin router 5G band (Network 2) and run a online speed test shows about 90-100 Mbps download and 70-80 Mbps upload. When I connect to netgear router wirelessly also 5G band (Network 1) and run a online speed test shows 230-260 download and 170-180 upload.

I know online speed tests are not accurate but the difference between network 1 and 2 are substantially different. Not sure if I should focus on coax cabling on network 2, replace old belkin router in AP mode or if issue is with network 2 being inline with ONT and STBs that are all MOCA 1.1 and may be limiting the speed on network 2.
 
update: solved issue with speed on network 2, I replaced the Belkin AC1200 router on network 2 with a RAX10 AX1800 router and speeds on network 2 significantly faster. GoCoax adapters running great
 
Everything is still running great but still could not understand what the GCD values mean in the MOCA status screen. I emailed GoCoax and got the following response:

Hello Lee, Sorry for the confusing. Actually, there is no meaning for GCD. For the table, you can find it is for the link rate for different adapters. For example, from node 0 to node 1. But from node 0 to node 0, it is meaningless. Regards, goCoax

So I guess whatever numbers show up in the shaded blocks do not mean anything.
 

Sign Up For SNBForums Daily Digest

Get an update of what's new every day delivered to your mailbox. Sign up here!
Top