What's new

SNMP - AX88u

  • SNBForums Code of Conduct

    SNBForums is a community for everyone, no matter what their level of experience.

    Please be tolerant and patient of others, especially newcomers. We are all here to share and learn!

    The rules are simple: Be patient, be nice, be helpful or be gone!

xtv

Occasional Visitor
Hello,
I've noticed that in a recent FW (386.1_2) "snmp" support has been introduced for ax86u.

Is there any chance it will soon hit ax88u too?
More or less this is the only important feature I feel it's missing.

Note: I'm referring to the regular Net-SNMPd and not to "mini_snpmd".
"mini_snmpd" is nice and small, but also it is way too limited: not customizable with specific router info, no more than 8 interfaces (on ax88u we have 8lan+wan+backup wan+2,5Ghz+5GHz+vpn_itf), no SNMPv3 authentication, etc...
 
Just an update, out of a fresh test with FW 386.2: the snmpd package from opkg still causes the router's kernel to crash (badly).

Code:
kernel: Unable to handle kernel NULL pointer dereference at virtual address 00000000
kernel: pgd = ffffffc02b47e000
kernel: [00000000] *pgd=000000002a96c003, *pud=000000002a96c003, *pmd=0000000000000000
kernel: Internal error: Oops: 96000006 [#1] PREEMPT SMP
kernel: CPU: 1 PID: 3767 Comm: snmpd Tainted: P           O    4.1.51 #2
kernel: Hardware name: Broadcom-v8A (DT)
kernel: task: ffffffc020524a80 ti: ffffffc020abc000 task.ti: ffffffc020abc000
kernel: PC is at ioctl_handle_mii+0x120/0x1b8 [bcm_enet]
kernel: LR is at ioctl_handle_mii+0x120/0x1b8 [bcm_enet]
kernel: pc : [<ffffffbffc427458>] lr : [<ffffffbffc427458>] pstate: 60000145
kernel: sp : ffffffc020abfc90
kernel: x29: ffffffc020abfc90 x28: ffffffc020abc000
kernel: x27: ffffffc000534000 x26: 000000000000001d
kernel: x25: 000000000000011a x24: 0000007fce473b88
kernel: x23: ffffffbffc42aea0 x22: ffffffc020abfd98
kernel: x21: ffffffc030272000 x20: ffffffc020abfd98
kernel: x19: 0000000000008947 x18: 0000000000000014
kernel: x17: 000000000000000f x16: ffffffc000150120
kernel: x15: 0000000000000000 x14: 0000000000000000
kernel: x13: 0000000000000000 x12: 0000000000000020
kernel: x11: 0101010101010101 x10: fefefeff32677364
kernel: x9 : 7f7f7f7f7f7f7f7f x8 : fefefeff32677364
kernel: x7 : 0000000080808080 x6 : 0000000000000000
kernel: x5 : ffffffc000845000 x4 : ffffffc000845488
kernel: x3 : 0000000000000005 x2 : 000000000000ffff
kernel: x1 : 0000000000000076 x0 : 0000000000000000
kernel: Process snmpd (pid: 3767, stack limit = 0xffffffc020abc020)
kernel: Modules linked in: tdts_udbfw(O) init_addr(          (null) -           (null)), core_addr(ffffffbffc150000 - ffffffbffc1554b0)
kernel:  tdts_udb(PO) init_addr(          (null) -           (null)), core_addr(ffffffbffc31c000 - ffffffbffc33f554)
kernel:  tdts(PO) init_addr(          (null) -           (null)), core_addr(ffffffbffcb25000 - ffffffbffcb60e98)
kernel:  tun init_addr(          (null) -           (null)), core_addr(ffffffbffcb1a000 - ffffffbffcb1d54c)
kernel:  nf_nat_sip init_addr(          (null) -           (null)), core_addr(ffffffbffcb13000 - ffffffbffcb14998)
kernel:  nf_conntrack_sip init_addr(          (null) -           (null)), core_addr(ffffffbffcb08000 - ffffffbffcb0aff8)
...
# log lines removed due to post size limitation #
...
kernel: ---[ end trace ]---
 
This is a known issue.
I wrote a guide some years ago to install mini_snmp

I think the code will not work today because of some changes, but maybe it guides you in the right direction. I switched to zabbix and my own plugin.
 
Last edited:
This is a known issue.
I wrote a guide some years ago to install mini_snmp

I think the code will not work today because of some changes, but maybe it guides you in the right direction. I switched to zabbix and my own plugin.

Thanks for your answer.

"mini_snmpd" works, but unfortunately is way too limited.
Infact:
  • the number of interfaces that can be monitored is at most 8 and I need at least 10 (some can also be added dynamically)
  • there is no reasonably safe authentication support (SNMPv3)
  • it cannot be extended to support additional info (e.g. signal strength, details on clients, etc...)

On the other hand, Zabbix with a customized agent plugin could be an excellent solution (I see that opkg includes Zabbix5 agent), however while for enterprise level it would be a very good option (I do have some experience using Zabbix in business environments), for a small home office solution is way to heavy on the RPi I'm using for this purpose.

Sometime ago I did some testing and just monitoring a few devices got the system load of the RPi close to "1", while with a simpler cacti stays at "0,2" for like 20 active devices.

I just made a new test and this is what happens to IO by just installing Zabbix with inbound from 3 hosts (the part before is related to cacti with 15 active devices, some of them with a large number of datasets - e.g. signal strength for all wifi devices connected to the router, bind9 stats, environmental data, and much more - all secured with SNMPv3):
Schermata 2021-04-11 alle 15.42.51.png


The best solution for small environments (lighter footprint, and configurability) is cacti therefore I'd need a solid snmp service to rely on.


I'd rather favor Zabbix for general monitoring in case of need for more complex ACL, larger networks, need for a caching data proxy (for subnets that may be not reachable for Zabbix server) and structured issue notification/tracking, however to have a solid implementation you need to dedicate a server to Zabbix (not just an RPi).

P.S.: for even more detailed monitoring I've used also ELK stacks, but those would require more than one dedicated server with good performances (actually at least 3 nodes to build a reasonable cluster) making this a solution not suitable even for small-business environments.

While Zabbix and Elasticsearch can be installed on RPi, they perform very poorly (due to the IO limitations of the raspberry) and are useful only to make a limited test/training environment.
 
Most of the "out of the box" monitoring solutions works fine even on the asus devices.
But if it comes to more detailed device specific informations, like Wi-Fi antenna data per host etc. I had no luck with none of the existing solutions.

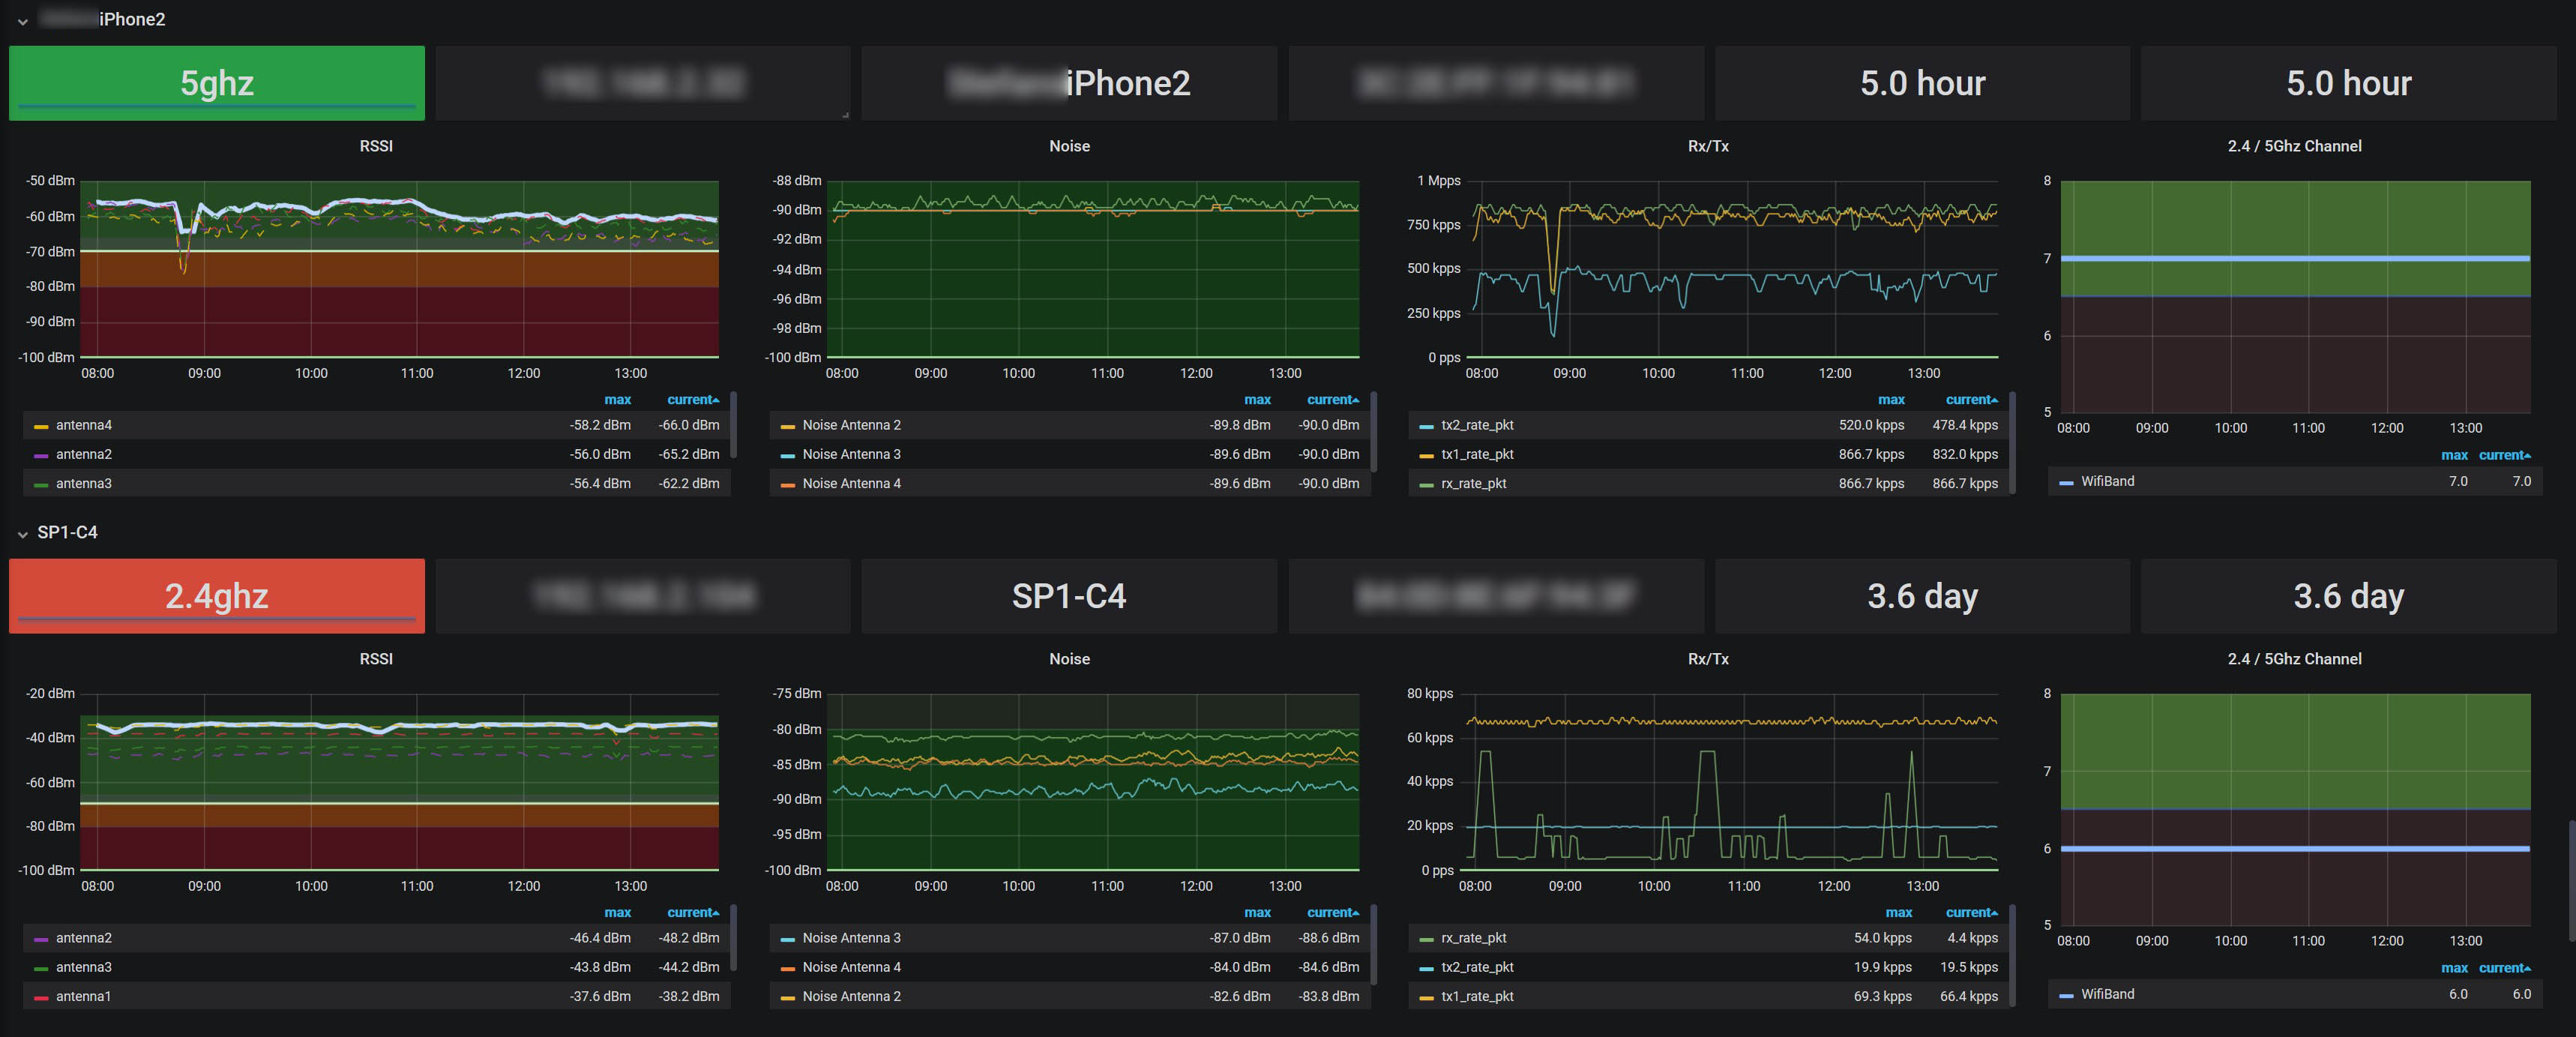
In my case, i mounted my rt-ax 88u inside my rack and had to switch to external antennas. To monitor each antenna signal strength if was looking for a more convenient survey as the build in wifi survey.
So i build extstat, which export all kind of infos into influx. It's some ancient and strange code inside, but if you want to give it a try, there you have all kinds of infos. I never released it here because i dont have the time to give support and i switched to pfsense for wan/dhcp/routing, but the code is public:

https://github.com/corgan2222/extstats


extstats_wifi.jpg
 
Most of the "out of the box" monitoring solutions works fine even on the asus devices.
But if it comes to more detailed device specific informations, like Wi-Fi antenna data per host etc. I had no luck with none of the existing solutions.

In my case, i mounted my rt-ax 88u inside my rack and had to switch to external antennas. To monitor each antenna signal strength if was looking for a more convenient survey as the build in wifi survey.
So i build extstat, which export all kind of infos into influx. It's some ancient and strange code inside, but if you want to give it a try, there you have all kinds of infos. I never released it here because i dont have the time to give support and i switched to pfsense for wan/dhcp/routing, but the code is public:

https://github.com/corgan2222/extstats

I perfectly understand you point as I had the same issues.
As a minimum I wanted to track detailed wifi info regarding all the connected devices to understand which one could have issues, when and is possible why.
Nothing "out of the box" had that level of detail, so I made up a small solution with a python based snmp server on a custom port secured via firewall (I know it's not the best, but it was better than nothing...) and customized to serve via SNMP the list of clients and the their signal strength when they are connected to 5Ghz or roam to 2.4GHz (I didn't find any info concerning the noise level) so that a cacti poller could pick up the info and chart it.
Unfortunately the python-snmp requires some thinking to make it work so it's not that easy to keep it up, but at least I'm getting all the info I need.

However your solution seems indeed very interesting and much more structured on the router side.

I'm still not sure about the resource requirements on the RPi with InfluxDB and Grafana, I've tested that solution but requires much more tinkering to monitor the rest of the network, while cacti has some nice tools to make it easier.

Anyway, as soon as I'll have some free time I'll absolutely give it a try on a spare RPi.
Cheers.
Would you mind sharing how you were able to get the list of clients and their signal strength via snmp? I wasn't able to identify the right mib and oid(s) for this when I was doing my snmp setup; or are you using snmp extend and scripts to pull the data?

Regarding InfluxDB and Grafana, I reckon there shouldn't be any issues running them on a RPi, as long as it's an RPi4 with at least 2GB RAM (4GB probably better).
I'm running Telegraf-InfluxDB-Grafana monitoring about a dozen devices and services (including the router) in a staging setup on a VM hosting their docker containers with 1vCPU and 2GB RAM assigned, without issues.

Actually I used an additional snmp-server written in python (since mini_snmpd cannot be customized), extended with some code to parse the file in `/tmp/allwclientlist.json` in order to serve data regarding clients, plus parsing of `/sys/class/thermal/thermal_zone0/temp` to supply cpu temperature.
The wifi temperature can be parsed from the result of command `wl -i itf phy_tempsense`; you should take the result of the command and multiply it by 500, add 20000, then divide by 1000 (at least on a RT-AX88u).

Regarding the RPi unfortunately testing on a VM is always not reliable, since with RPi the greatest constraint is not the CPU nor the RAM (at least not anymore with RPi4) but the very limited IO on the SDcard.
Currently I'm running my config on a RPi3 with lots of free memory and low CPU usage, however issues start when there is an intensive use of a database.
E.g.: MySQL IO can be tuned in the configuration, but it is possible to set a limit only as low as 100 iops (which is still a bit high for an SDcard consider also that performances may vary significantly from one SDcard to another... I've personally see changes of performances of about 1 order (10x) just by exchanging a 16GB card with a 64GB card - same brand - same generation).

P.S.: I've tested a Telegraf-InfluxDB-Grafana setup on a single RPi4 with an average performance SDcard, and I decided to stay with Cacti for the moment. Again, the issue there was the waiting time on IO...
Thanks for the tip regarding the json file in /tmp. On the RT-AX86U it seems to be /tmp/clientlist.json that has IP and RSSI data beyond just MAC addresses.
Could you share your code for parsing the json and serving it via snmp? In my approach I'm only passing single stats via snmp extend, as I haven't figured out yet how to pass more complex data structures. I've been thinking of eventually doing it by pushing the data directly into InfluxDB, but if there's a not too complicated way via snmp that would be preferable. :)

You're right regarding historic IO constraints with RPI3, but I reckon the situation should be leaps and bounds better now that RPI4 supports (also booting from) SSD drives through USB3.0 (with UASP).
Now that I'm looking at it, there are some pretty impressive SSD performance stats on the RPi4 nowadays. Based on the results even something more affordable like a Samsung EVO 860 may be enough for such a use case.
Parsing text files is usually considered a resource intensive task, thus, since I want to preserve as much as possible the router resources I preferred to bypass snmp for wifi stats.
Also I want to limit also as much as possible any recurrent event that access the filesystem to avoid waiting time on the cpu. If you have, lets say 25 devices attached to the router you will have to open the file 25 times and parse it at least 25 times per value you want to get via snmp.
The same goes is for accessing data via "wl" command, that should be limited as much as possible.

For this reason I used a systemd trigger to fetch the entire file from the router every 5 minutes (cacti poller frequency) and setup a python script to extend the poller to parse the file and feed them into cacti RRA files as per standard procedure.

That allows me to fetch more than devices signal strength levels with the detail in the picture (in blue when the device is connected to 5Ghz and yellow when the device is connected to 2.4GHz) with negligible impact on the router.

Schermata 2021-04-12 alle 19.34.12.png


On the cacti server (an RPi3 with a good SDcard - but still an SDcard...) I mange like 20 devices with as much info as possible fetched (probably between 200 and 300 datasources - or timeseries) causing a 0.15 average load.

The code is in python and I've written it specifically for Cacti v1.2.x and is not only a script but a set of scripts/templates for Cacti.
If you are interested I could put that on GitHub, but atm I don't have much time clean it up...

P.S.: to squeeze even more the overhead I don't call the actual python source, but the compiled bytecode.

Regarding SSDs and RPi4, you are right, with that setup performance are much much higher, but I don't want to have multiple boxes around nor I'm keen to host the root filesystem on an external device connected with a cable... The only exception to this rule is the USB stick for router, which is necessary and placed in a way that is impossible move it accidentally, but besides this I want every device "cased" so that is self contained.
 
Have you checked these allwclientlist.json is generated automatically on an interval without opening the routers config page? I'm not sure about this, but I think I have read some workaround here in the forum.

Would you mind sharing how you were able to get the list of clients and their signal strength via snmp? I wasn't able to identify the right mib and oid(s) for this when I was doing my snmp setup; or are you using snmp extend and scripts to pull the data?

 
Most of the "out of the box" monitoring solutions works fine even on the asus devices.
But if it comes to more detailed device specific informations, like Wi-Fi antenna data per host etc. I had no luck with none of the existing solutions.

In my case, i mounted my rt-ax 88u inside my rack and had to switch to external antennas. To monitor each antenna signal strength if was looking for a more convenient survey as the build in wifi survey.
So i build extstat, which export all kind of infos into influx. It's some ancient and strange code inside, but if you want to give it a try, there you have all kinds of infos. I never released it here because i dont have the time to give support and i switched to pfsense for wan/dhcp/routing, but the code is public:

https://github.com/corgan2222/extstats

Since I was very curious, yesterday evening I've setup a test for your extStats package.
It is very easy to setup and the data was flowing in the InfluxDB, however the burden on the router's CPU usage was significant.
Usually, when no one is browsing the router's UI and there is no heavy VPN usage, the CPU usage sits at about 5% (including cacti monitoring), but activating all extStats outbound modules (besides spdStats and constats which I don't use) the CPU usage went up to 20-30%.
I've had a quick look at the code and I'd have a few ideas (even tho' I understand that these choices are made for code maintainability), including:
  • moving as much code as possible from bash scripting to something more self contained (like python or perl - probably python leveraging cached bytecode would reduce overhead when the script is started)
  • reducing the calls to "wl" command to the strict minimum
  • avoiding extensive use of "awk" and similar commands and rather do the parsing of a command (e.g. "wl") with a single passage (easier in a python/perl script) to minimize overhead
  • reducing the amount of data transferred by reducing the polling frequency or make it user configurable (1 sample every 10 seconds is useful for debug purposes, but is way too high for regular monitoring - personally I'd find acceptable a sample every minute or even every 5 minutes)
Unfortunately, while monitoring a system, the more you get near to the granularity you desire the more you influence the results themselves... something similar to the Heisenberg principle :p.

If the target is to feed data mainly into InfluxDB, I would also consider the option of using Telegraf on the router with one or more dedicated plugins. Not sure if that would be better of worse from a resource footprint perspective, but a quick proof of concept for this approach could be interesting.

For serving data via SNMP, I'd rather prepare one or more files in background so that SNMP server can quickly pick the value to serve. Another option could be using a Redis db to store actual data. The best case (also for feeding InfluxDB) would probably be to get the values from "/proc", but I don't know if that kind of data is available there...
 
strange, my RT-AX88u is nearly sleeping and this is with extstats and zabbix running. Which router do you use?

1618310843406.png


But as I wrote earlier, I wrote this some years ago, there was no telegraf on the router. :) And i could only test it on my system.
Maybe there are some problems while executing which produces the load. Try to test one module after each other.
Thanks for the tips!
Sadly i don't have the time to maintain such a public project. But feel free to fork and make PRs. :)
 
strange, my RT-AX88u is nearly sleeping and this is with extstats and zabbix running. Which router do you use?


But as I wrote earlier, I wrote this some years ago, there was no telegraf on the router. :) And i could only test it on my system.
Maybe there are some problems while executing which produces the load. Try to test one module after each other.
Thanks for the tips!
Sadly i don't have the time to maintain such a public project. But feel free to fork and make PRs. :)
I'm using a RT-AX88u... I don't know, maybe I'll test it again :)

Anyway in the lunch break I've tested Telegraf (installed via opkg)...
I'm puling all info I can from the router (37 series, for I don't know how many fields per serie), the CPU usage almost didn't move.
The drawbacks here are: about 85MB of memory eaten (not necessarily and issue, depends on what else is installed), needs dedicated plugins to pull info such as temperature, wifi details and vpn traffic/stats...
The memory issue is probably due to the usage of an executable with all plugins burned in... (I generated the config and came out 280kB!! of text file o_O)
Yeah, installing Telegraf on the router itself may be a bit of an overkill, given that everything you can see below (and more, including traffic stats for all interfaces) can be pulled via snmp and standard MIBs. Anything that can't would involve scripting and parsing anyway, and at that point you may be better off pushing that to the db directly.

As a side note, one interesting thing I've found is that for data stored in json files on the router jq can be used to parse and send it directly to the db.

grafana-asus.png
 
Have you checked these allwclientlist.json is generated automatically on an interval without opening the routers config page? I'm not sure about this, but I think I have read some workaround here in the forum.


Thanks, this looks great and captures pretty much the exact data I'd like to extend my snmp setup with.
At the same time, I'm not that experienced with scripting, so I may reach out directly if I get stuck when modifying or interpreting certain things in your work, if that's ok. :)
 
Yeah, installing Telegraf on the router itself may be a bit of an overkill, given that everything you can see below (and more, including traffic stats for all interfaces) can be pulled via snmp and standard MIBs. Anything that can't would involve scripting and parsing anyway, and at that point you may be better off pushing that to the db directly.

As a side note, one interesting thing I've found is that for data stored in json files on the router jq can be used to parse and send it directly to the db.

View attachment 33169
Well true, my N°1 choice would be to use SNMP (as per 1st post) since it's standard, lightweight and can be secured, however unfortunately the real-thing (net-snmp) is still not available for AX88u (it causes a kernel crash), while mini_snpmd doesn't serve much info, is not extendable and cannot be secured with v3 protocol...
Moreover, besides the standard info, what I find particularly useful is data at single connected-client level (e.g. throughput and wifi signal strength would be more than enough), thus the basic SNMP must be extended.

This is why SNMP compatibility for AX88u is my N°1 wanted feature.


P.S.: even with net-snmp I would be careful implementing extensions, since for every single SNMP value that is polled a script is loaded, interpreted and executed to produce the value (in the perspective that the router should spend his time routing and not collecting data ;) ).

This is exactly what I was looking for, but it was simply not existing at the time I wrote extstats.
 
Yeah, installing Telegraf on the router itself may be a bit of an overkill,

As a side note, one interesting thing I've found is that for data stored in json files on the router jq can be used to parse and send it directly to the db.

Sadly this json files didn't exist at the time I wrote my plugin. This helps a lot by generating the data if there are generated by the os constantly and not only if the UI is opend in the browser.
 

Similar threads

Latest threads

Sign Up For SNBForums Daily Digest

Get an update of what's new every day delivered to your mailbox. Sign up here!
Top