bengalih
Senior Member
Apologies if asked before but short terms like "cpu" and "top" don't come up in search.
I have several packages installed on my RT-AC68U including nginx proxy.
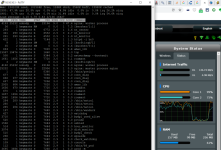
I notice that my CPU utilization in the dashboard may be showing high utilization of both cores at times (80%+).
However, during this same interval, a "top" within the shell only shows my CPU at about 17%.
Can someone explain the discrepancy and is there a better way to get accurate CPU utilization in the shell (assuming the dashboard is correct)?
Thanks!
I have several packages installed on my RT-AC68U including nginx proxy.
I notice that my CPU utilization in the dashboard may be showing high utilization of both cores at times (80%+).
However, during this same interval, a "top" within the shell only shows my CPU at about 17%.
Can someone explain the discrepancy and is there a better way to get accurate CPU utilization in the shell (assuming the dashboard is correct)?
Thanks!